Navajo vs Haitian In Labor Force | Age 20-24
COMPARE
Navajo
Haitian
In Labor Force | Age 20-24
In Labor Force | Age 20-24 Comparison
Navajo
Haitians
64.8%
IN LABOR FORCE | AGE 20-24
0.0/ 100
METRIC RATING
347th/ 347
METRIC RANK
73.6%
IN LABOR FORCE | AGE 20-24
0.5/ 100
METRIC RATING
266th/ 347
METRIC RANK
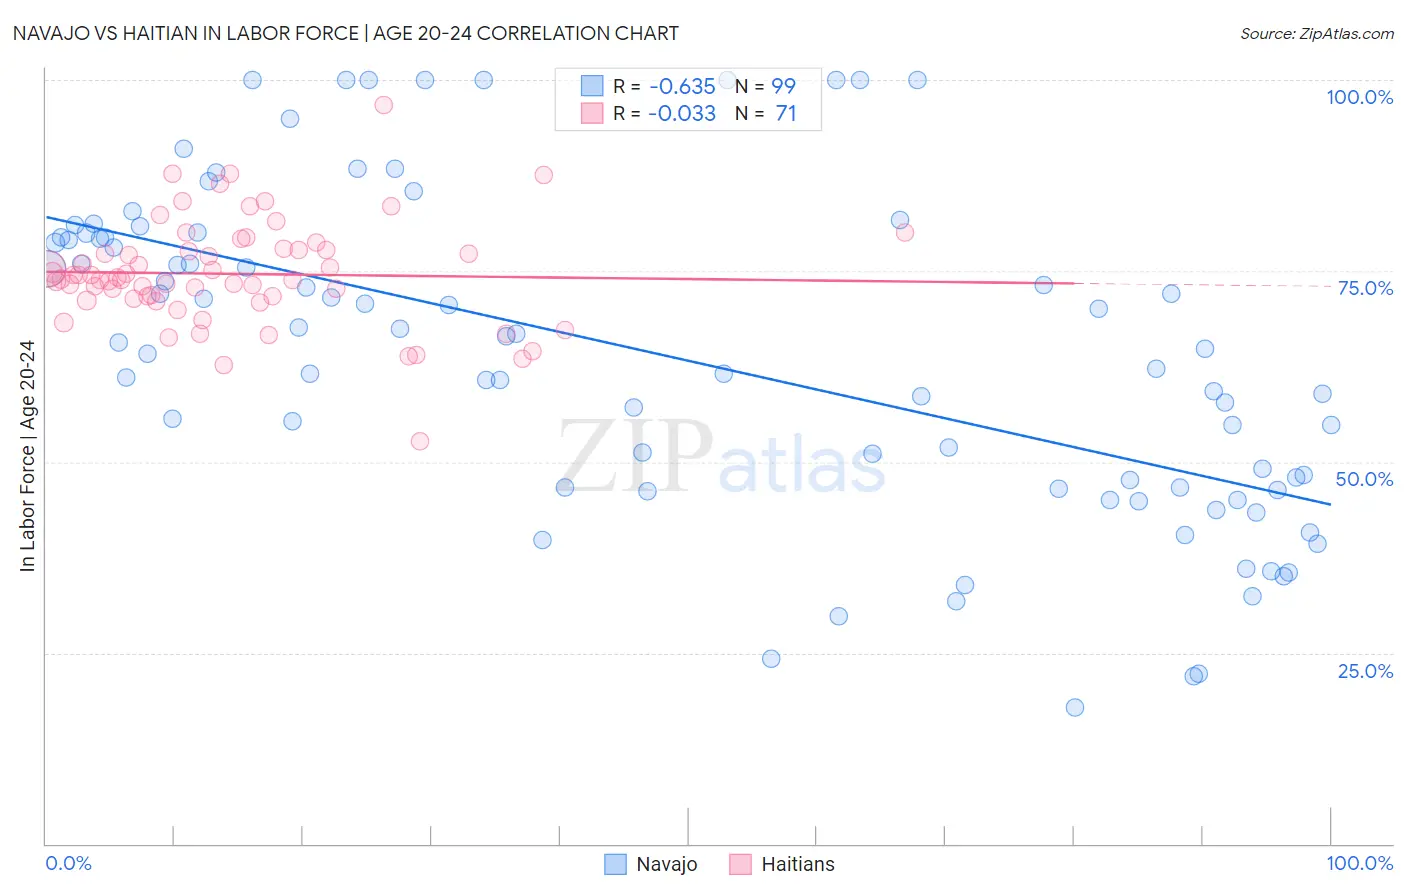
Navajo vs Haitian In Labor Force | Age 20-24 Correlation Chart
The statistical analysis conducted on geographies consisting of 224,781,788 people shows a significant negative correlation between the proportion of Navajo and labor force participation rate among population between the ages 20 and 24 in the United States with a correlation coefficient (R) of -0.635 and weighted average of 64.8%. Similarly, the statistical analysis conducted on geographies consisting of 287,953,758 people shows no correlation between the proportion of Haitians and labor force participation rate among population between the ages 20 and 24 in the United States with a correlation coefficient (R) of -0.033 and weighted average of 73.6%, a difference of 13.5%.
In Labor Force | Age 20-24 Correlation Summary
| Measurement | Navajo | Haitian |
| Minimum | 17.9% | 52.7% |
| Maximum | 100.0% | 96.7% |
| Range | 82.1% | 44.0% |
| Mean | 63.8% | 74.6% |
| Median | 64.7% | 73.9% |
| Interquartile 25% (IQ1) | 46.6% | 71.3% |
| Interquartile 75% (IQ3) | 79.4% | 77.7% |
| Interquartile Range (IQR) | 32.8% | 6.4% |
| Standard Deviation (Sample) | 21.0% | 6.9% |
| Standard Deviation (Population) | 20.9% | 6.9% |
Similar Demographics by In Labor Force | Age 20-24
Demographics Similar to Navajo by In Labor Force | Age 20-24
In terms of in labor force | age 20-24, the demographic groups most similar to Navajo are Lumbee (65.5%, a difference of 1.1%), Hopi (66.0%, a difference of 1.8%), Immigrants from Grenada (67.2%, a difference of 3.6%), Puerto Rican (68.3%, a difference of 5.4%), and Immigrants from St. Vincent and the Grenadines (68.4%, a difference of 5.5%).
| Demographics | Rating | Rank | In Labor Force | Age 20-24 |
| Yuman | 0.0 /100 | #333 | Tragic 70.3% |
| British West Indians | 0.0 /100 | #334 | Tragic 70.0% |
| Immigrants | Barbados | 0.0 /100 | #335 | Tragic 69.7% |
| Immigrants | Guyana | 0.0 /100 | #336 | Tragic 69.3% |
| Guyanese | 0.0 /100 | #337 | Tragic 69.2% |
| Pima | 0.0 /100 | #338 | Tragic 69.0% |
| Immigrants | Yemen | 0.0 /100 | #339 | Tragic 68.9% |
| Menominee | 0.0 /100 | #340 | Tragic 68.7% |
| Tohono O'odham | 0.0 /100 | #341 | Tragic 68.6% |
| Immigrants | St. Vincent and the Grenadines | 0.0 /100 | #342 | Tragic 68.4% |
| Puerto Ricans | 0.0 /100 | #343 | Tragic 68.3% |
| Immigrants | Grenada | 0.0 /100 | #344 | Tragic 67.2% |
| Hopi | 0.0 /100 | #345 | Tragic 66.0% |
| Lumbee | 0.0 /100 | #346 | Tragic 65.5% |
| Navajo | 0.0 /100 | #347 | Tragic 64.8% |
Demographics Similar to Haitians by In Labor Force | Age 20-24
In terms of in labor force | age 20-24, the demographic groups most similar to Haitians are Burmese (73.6%, a difference of 0.0%), Immigrants from Haiti (73.6%, a difference of 0.020%), Immigrants from Asia (73.6%, a difference of 0.030%), Immigrants from Western Asia (73.5%, a difference of 0.040%), and South American (73.5%, a difference of 0.090%).
| Demographics | Rating | Rank | In Labor Force | Age 20-24 |
| Dutch West Indians | 0.7 /100 | #259 | Tragic 73.7% |
| Immigrants | Turkey | 0.7 /100 | #260 | Tragic 73.7% |
| Houma | 0.6 /100 | #261 | Tragic 73.7% |
| Asians | 0.6 /100 | #262 | Tragic 73.7% |
| Immigrants | Asia | 0.5 /100 | #263 | Tragic 73.6% |
| Immigrants | Haiti | 0.5 /100 | #264 | Tragic 73.6% |
| Burmese | 0.5 /100 | #265 | Tragic 73.6% |
| Haitians | 0.5 /100 | #266 | Tragic 73.6% |
| Immigrants | Western Asia | 0.4 /100 | #267 | Tragic 73.5% |
| South Americans | 0.4 /100 | #268 | Tragic 73.5% |
| Colombians | 0.3 /100 | #269 | Tragic 73.5% |
| Immigrants | Russia | 0.3 /100 | #270 | Tragic 73.5% |
| Immigrants | Indonesia | 0.3 /100 | #271 | Tragic 73.4% |
| Belizeans | 0.3 /100 | #272 | Tragic 73.4% |
| Cheyenne | 0.2 /100 | #273 | Tragic 73.4% |