Native Hawaiian vs Alsatian In Labor Force | Age > 16
COMPARE
Native Hawaiian
Alsatian
In Labor Force | Age > 16
In Labor Force | Age > 16 Comparison
Native Hawaiians
Alsatians
64.1%
IN LABOR FORCE | AGE > 16
0.3/ 100
METRIC RATING
272nd/ 347
METRIC RANK
64.7%
IN LABOR FORCE | AGE > 16
10.7/ 100
METRIC RATING
218th/ 347
METRIC RANK
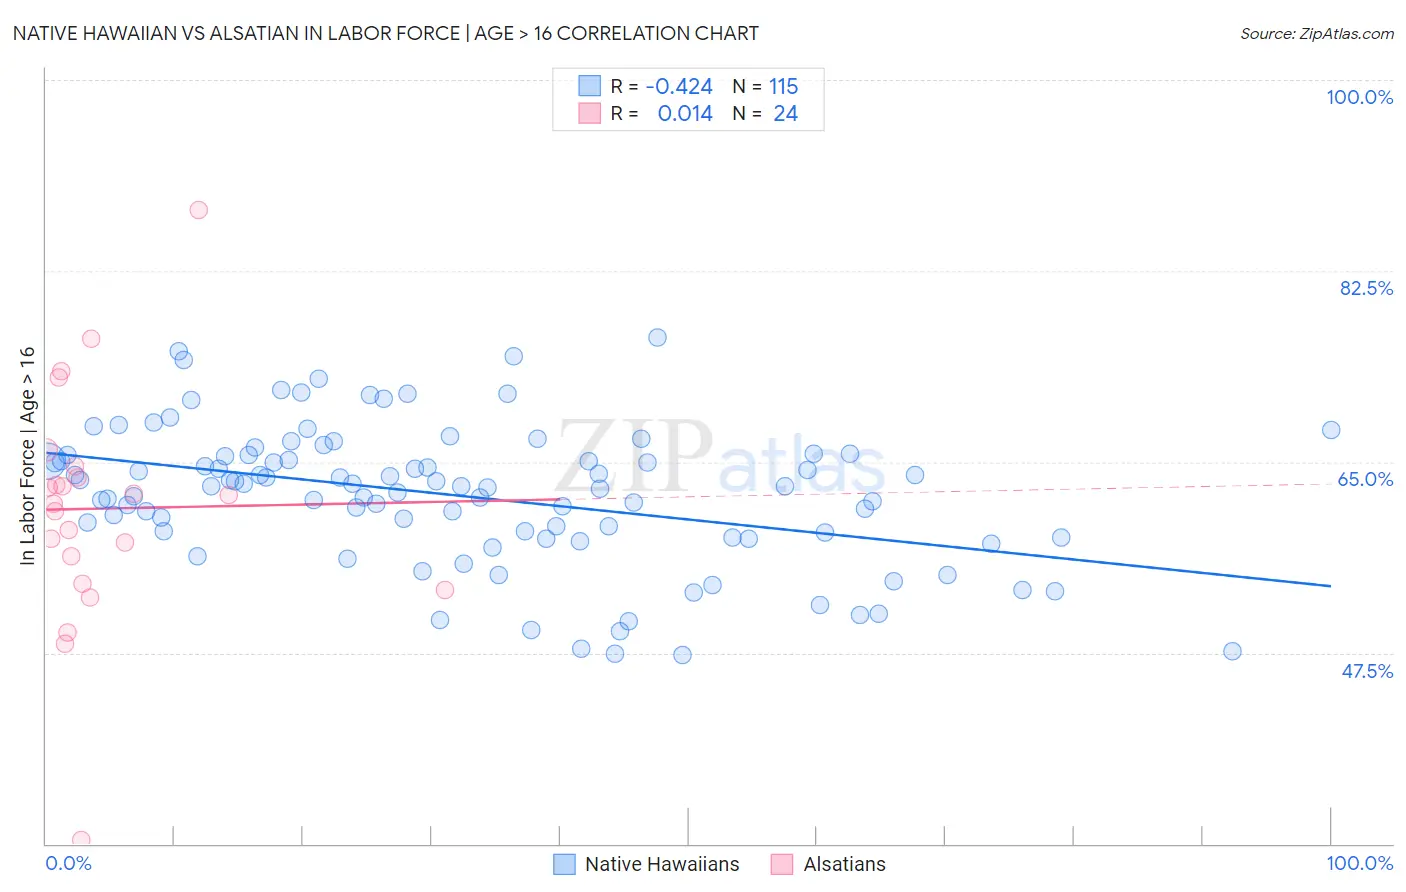
Native Hawaiian vs Alsatian In Labor Force | Age > 16 Correlation Chart
The statistical analysis conducted on geographies consisting of 332,118,603 people shows a moderate negative correlation between the proportion of Native Hawaiians and labor force participation rate among population ages 16 and over in the United States with a correlation coefficient (R) of -0.424 and weighted average of 64.1%. Similarly, the statistical analysis conducted on geographies consisting of 82,681,658 people shows no correlation between the proportion of Alsatians and labor force participation rate among population ages 16 and over in the United States with a correlation coefficient (R) of 0.014 and weighted average of 64.7%, a difference of 1.0%.
In Labor Force | Age > 16 Correlation Summary
| Measurement | Native Hawaiian | Alsatian |
| Minimum | 47.3% | 30.3% |
| Maximum | 76.4% | 88.1% |
| Range | 29.1% | 57.8% |
| Mean | 61.9% | 60.7% |
| Median | 62.8% | 61.6% |
| Interquartile 25% (IQ1) | 58.1% | 55.1% |
| Interquartile 75% (IQ3) | 65.6% | 64.1% |
| Interquartile Range (IQR) | 7.5% | 9.0% |
| Standard Deviation (Sample) | 6.3% | 11.0% |
| Standard Deviation (Population) | 6.3% | 10.8% |
Similar Demographics by In Labor Force | Age > 16
Demographics Similar to Native Hawaiians by In Labor Force | Age > 16
In terms of in labor force | age > 16, the demographic groups most similar to Native Hawaiians are Hmong (64.1%, a difference of 0.0%), Immigrants from Cuba (64.1%, a difference of 0.020%), Mexican (64.1%, a difference of 0.020%), French American Indian (64.1%, a difference of 0.020%), and Guyanese (64.1%, a difference of 0.030%).
| Demographics | Rating | Rank | In Labor Force | Age > 16 |
| Cubans | 0.5 /100 | #265 | Tragic 64.2% |
| Immigrants | England | 0.5 /100 | #266 | Tragic 64.2% |
| Canadians | 0.5 /100 | #267 | Tragic 64.1% |
| Spaniards | 0.5 /100 | #268 | Tragic 64.1% |
| Irish | 0.4 /100 | #269 | Tragic 64.1% |
| Guyanese | 0.4 /100 | #270 | Tragic 64.1% |
| Dominicans | 0.4 /100 | #271 | Tragic 64.1% |
| Native Hawaiians | 0.3 /100 | #272 | Tragic 64.1% |
| Hmong | 0.3 /100 | #273 | Tragic 64.1% |
| Immigrants | Cuba | 0.3 /100 | #274 | Tragic 64.1% |
| Mexicans | 0.3 /100 | #275 | Tragic 64.1% |
| French American Indians | 0.3 /100 | #276 | Tragic 64.1% |
| Immigrants | Bahamas | 0.3 /100 | #277 | Tragic 64.0% |
| Assyrians/Chaldeans/Syriacs | 0.3 /100 | #278 | Tragic 64.0% |
| Welsh | 0.2 /100 | #279 | Tragic 64.0% |
Demographics Similar to Alsatians by In Labor Force | Age > 16
In terms of in labor force | age > 16, the demographic groups most similar to Alsatians are Immigrants from Central America (64.7%, a difference of 0.010%), Belgian (64.7%, a difference of 0.020%), U.S. Virgin Islander (64.7%, a difference of 0.020%), Alaska Native (64.7%, a difference of 0.030%), and Immigrants from Micronesia (64.7%, a difference of 0.030%).
| Demographics | Rating | Rank | In Labor Force | Age > 16 |
| Fijians | 14.1 /100 | #211 | Poor 64.8% |
| Alaskan Athabascans | 13.9 /100 | #212 | Poor 64.8% |
| Maltese | 13.8 /100 | #213 | Poor 64.8% |
| Estonians | 13.1 /100 | #214 | Poor 64.8% |
| Immigrants | Czechoslovakia | 12.3 /100 | #215 | Poor 64.8% |
| Belgians | 11.4 /100 | #216 | Poor 64.7% |
| U.S. Virgin Islanders | 11.3 /100 | #217 | Poor 64.7% |
| Alsatians | 10.7 /100 | #218 | Poor 64.7% |
| Immigrants | Central America | 10.5 /100 | #219 | Poor 64.7% |
| Alaska Natives | 9.9 /100 | #220 | Tragic 64.7% |
| Immigrants | Micronesia | 9.6 /100 | #221 | Tragic 64.7% |
| Hawaiians | 9.3 /100 | #222 | Tragic 64.7% |
| Immigrants | Belize | 9.2 /100 | #223 | Tragic 64.7% |
| Immigrants | Jamaica | 8.8 /100 | #224 | Tragic 64.7% |
| Croatians | 8.8 /100 | #225 | Tragic 64.7% |