Alaska Native vs Inupiat In Labor Force | Age 20-24
COMPARE
Alaska Native
Inupiat
In Labor Force | Age 20-24
In Labor Force | Age 20-24 Comparison
Alaska Natives
Inupiat
75.9%
IN LABOR FORCE | AGE 20-24
95.1/ 100
METRIC RATING
115th/ 347
METRIC RANK
74.6%
IN LABOR FORCE | AGE 20-24
17.6/ 100
METRIC RATING
205th/ 347
METRIC RANK
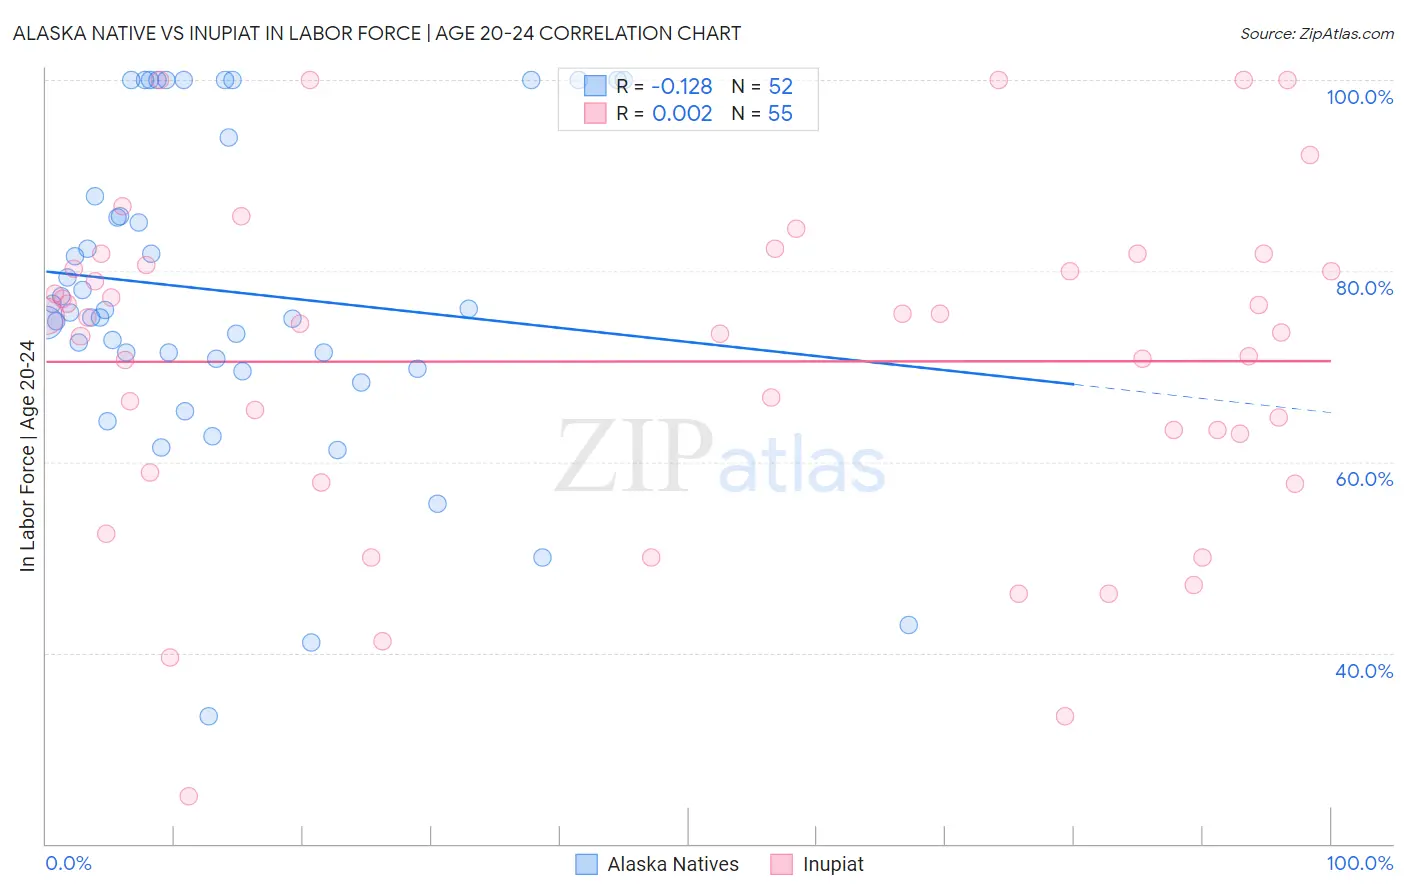
Alaska Native vs Inupiat In Labor Force | Age 20-24 Correlation Chart
The statistical analysis conducted on geographies consisting of 76,758,773 people shows a poor negative correlation between the proportion of Alaska Natives and labor force participation rate among population between the ages 20 and 24 in the United States with a correlation coefficient (R) of -0.128 and weighted average of 75.9%. Similarly, the statistical analysis conducted on geographies consisting of 96,340,626 people shows no correlation between the proportion of Inupiat and labor force participation rate among population between the ages 20 and 24 in the United States with a correlation coefficient (R) of 0.002 and weighted average of 74.6%, a difference of 1.7%.
In Labor Force | Age 20-24 Correlation Summary
| Measurement | Alaska Native | Inupiat |
| Minimum | 33.3% | 25.0% |
| Maximum | 100.0% | 100.0% |
| Range | 66.7% | 75.0% |
| Mean | 77.8% | 70.5% |
| Median | 75.8% | 74.5% |
| Interquartile 25% (IQ1) | 70.3% | 58.9% |
| Interquartile 75% (IQ3) | 90.9% | 80.6% |
| Interquartile Range (IQR) | 20.7% | 21.7% |
| Standard Deviation (Sample) | 16.5% | 17.3% |
| Standard Deviation (Population) | 16.4% | 17.1% |
Similar Demographics by In Labor Force | Age 20-24
Demographics Similar to Alaska Natives by In Labor Force | Age 20-24
In terms of in labor force | age 20-24, the demographic groups most similar to Alaska Natives are Immigrants from Zimbabwe (75.9%, a difference of 0.0%), Immigrants from Netherlands (75.9%, a difference of 0.010%), Immigrants from North America (75.9%, a difference of 0.010%), Assyrian/Chaldean/Syriac (75.9%, a difference of 0.010%), and Spanish American (75.8%, a difference of 0.020%).
| Demographics | Rating | Rank | In Labor Force | Age 20-24 |
| Iraqis | 96.6 /100 | #108 | Exceptional 76.0% |
| Cherokee | 95.8 /100 | #109 | Exceptional 75.9% |
| Immigrants | Morocco | 95.8 /100 | #110 | Exceptional 75.9% |
| Ukrainians | 95.7 /100 | #111 | Exceptional 75.9% |
| Immigrants | Canada | 95.6 /100 | #112 | Exceptional 75.9% |
| Immigrants | Netherlands | 95.3 /100 | #113 | Exceptional 75.9% |
| Immigrants | Zimbabwe | 95.1 /100 | #114 | Exceptional 75.9% |
| Alaska Natives | 95.1 /100 | #115 | Exceptional 75.9% |
| Immigrants | North America | 95.0 /100 | #116 | Exceptional 75.9% |
| Assyrians/Chaldeans/Syriacs | 94.9 /100 | #117 | Exceptional 75.9% |
| Spanish Americans | 94.8 /100 | #118 | Exceptional 75.8% |
| Immigrants | Portugal | 94.8 /100 | #119 | Exceptional 75.8% |
| Immigrants | Africa | 94.6 /100 | #120 | Exceptional 75.8% |
| Immigrants | Serbia | 94.3 /100 | #121 | Exceptional 75.8% |
| Pakistanis | 94.1 /100 | #122 | Exceptional 75.8% |
Demographics Similar to Inupiat by In Labor Force | Age 20-24
In terms of in labor force | age 20-24, the demographic groups most similar to Inupiat are Immigrants from Italy (74.6%, a difference of 0.0%), Sioux (74.6%, a difference of 0.0%), Immigrants from Northern Africa (74.6%, a difference of 0.010%), Albanian (74.6%, a difference of 0.040%), and Immigrants from Uruguay (74.6%, a difference of 0.050%).
| Demographics | Rating | Rank | In Labor Force | Age 20-24 |
| Immigrants | Nigeria | 24.2 /100 | #198 | Fair 74.7% |
| Taiwanese | 23.2 /100 | #199 | Fair 74.7% |
| Nigerians | 21.9 /100 | #200 | Fair 74.7% |
| Choctaw | 21.4 /100 | #201 | Fair 74.7% |
| Moroccans | 20.4 /100 | #202 | Fair 74.7% |
| Immigrants | Northern Africa | 17.9 /100 | #203 | Poor 74.6% |
| Immigrants | Italy | 17.6 /100 | #204 | Poor 74.6% |
| Inupiat | 17.6 /100 | #205 | Poor 74.6% |
| Sioux | 17.5 /100 | #206 | Poor 74.6% |
| Albanians | 16.2 /100 | #207 | Poor 74.6% |
| Immigrants | Uruguay | 15.8 /100 | #208 | Poor 74.6% |
| Arabs | 15.8 /100 | #209 | Poor 74.6% |
| Uruguayans | 15.1 /100 | #210 | Poor 74.6% |
| Immigrants | Australia | 14.7 /100 | #211 | Poor 74.6% |
| Creek | 13.3 /100 | #212 | Poor 74.5% |