Native Hawaiian vs Mexican In Labor Force | Age 35-44

COMPARE

Native Hawaiian
Race
Ancestry
AfghanAfricanAlaska NativeAlaskan AthabascanAlbanianAleutAlsatianAmericanApacheArabArapahoArgentineanArmenianAssyrian/Chaldean/SyriacAustralianAustrianBahamianBangladeshiBarbadianBasqueBelgianBelizeanBermudanBhutaneseBlackfeetBolivianBrazilianBritishBritish West IndianBulgarianBurmeseCajunCambodianCanadianCape VerdeanCarpatho RusynCelticCentral AmericanCentral American IndianCherokeeCheyenneChickasawChileanChineseChippewaChoctawColombianColvilleComancheCosta RicanCreeCreekCroatianCrowCubanCypriotCzechCzechoslovakianDanishDelawareDominicanDutchDutch West IndianEastern EuropeanEcuadorianEgyptianEnglishEstonianEthiopianEuropeanFijianFilipinoFinnishFrenchFrench American IndianFrench CanadianGermanGerman RussianGhanaianGreekGuamanian/ChamorroGuatemalanGuyaneseHaitianHmongHonduranHopiHoumaHungarianIcelanderIndian (Asian)IndonesianInupiatIranianIraqiIrishIroquoisIsraeliItalianJamaicanJapaneseJordanianKenyanKiowaKoreanLaotianLatvianLebaneseLiberianLithuanianLumbeeLuxembourgerMacedonianMalaysianMalteseMarshalleseMenomineeMexican American IndianMongolianMoroccanNative HawaiianNavajoNepaleseNew ZealanderNicaraguanNigerianNorthern EuropeanNorwegianOkinawanOsageOttawaPaiutePakistaniPalestinianPanamanianParaguayanPennsylvania GermanPeruvianPimaPolishPortuguesePotawatomiPuebloPuerto RicanPuget Sound SalishRomanianRussianSalvadoranSamoanScandinavianScotch-IrishScottishSeminoleSenegaleseSerbianShoshoneSierra LeoneanSiouxSlavicSlovakSloveneSomaliSouth AfricanSouth AmericanSouth American IndianSoviet UnionSpaniardSpanishSpanish AmericanSpanish American IndianSri LankanSubsaharan AfricanSudaneseSwedishSwissSyrianTaiwaneseThaiTlingit-HaidaTohono O'OdhamTonganTrinidadian and TobagonianTsimshianTurkishU.S. Virgin IslanderUgandanUkrainianUruguayanUteVenezuelanVietnameseWelshWest IndianYakamaYaquiYugoslavianYumanYup'ikZimbabwean
Immigration
NonimmigrantsImmigrantsAfghanistanAfricaAlbaniaArgentinaArmeniaAsiaAustraliaAustriaBahamasBangladeshBarbadosBelarusBelgiumBelizeBoliviaBosnia and HerzegovinaBrazilBulgariaBurma/MyanmarCabo VerdeCambodiaCameroonCanadaCaribbeanCentral AmericaChileChinaColombiaCongoCosta RicaCroatiaCubaCzechoslovakiaDenmarkDominicaDominican RepublicEastern AfricaEastern AsiaEastern EuropeEcuadorEgyptEl SalvadorEnglandEritreaEthiopiaEuropeFijiFranceGermanyGhanaGreeceGrenadaGuatemalaGuyanaHaitiHondurasHong KongHungaryIndiaIndonesiaIranIraqIrelandIsraelItalyJamaicaJapanJordanKazakhstanKenyaKoreaKuwaitLaosLatin AmericaLatviaLebanonLiberiaLithuaniaMalaysiaMexicoMicronesiaMiddle AfricaMoldovaMoroccoNepalNetherlandsNicaraguaNigeriaNorth AmericaNorth MacedoniaNorthern AfricaNorthern EuropeNorwayOceaniaPakistanPanamaPeruPhilippinesPolandPortugalRomaniaRussiaSaudi ArabiaScotlandSenegalSerbiaSierra LeoneSingaporeSomaliaSouth AfricaSouth AmericaSouth Central AsiaSouth Eastern AsiaSouthern EuropeSpainSri LankaSt. Vincent and the GrenadinesSudanSwedenSwitzerlandSyriaTaiwanThailandTrinidad and TobagoTurkeyUgandaUkraineUruguayUzbekistanVenezuelaVietnamWest IndiesWestern AfricaWestern AsiaWestern EuropeYemenZaireZimbabweAzores
Mexican
Race
Ancestry
AfghanAfricanAlaska NativeAlaskan AthabascanAlbanianAleutAlsatianAmericanApacheArabArapahoArgentineanArmenianAssyrian/Chaldean/SyriacAustralianAustrianBahamianBangladeshiBarbadianBasqueBelgianBelizeanBermudanBhutaneseBlackfeetBolivianBrazilianBritishBritish West IndianBulgarianBurmeseCajunCambodianCanadianCape VerdeanCarpatho RusynCelticCentral AmericanCentral American IndianCherokeeCheyenneChickasawChileanChineseChippewaChoctawColombianColvilleComancheCosta RicanCreeCreekCroatianCrowCubanCypriotCzechCzechoslovakianDanishDelawareDominicanDutchDutch West IndianEastern EuropeanEcuadorianEgyptianEnglishEstonianEthiopianEuropeanFijianFilipinoFinnishFrenchFrench American IndianFrench CanadianGermanGerman RussianGhanaianGreekGuamanian/ChamorroGuatemalanGuyaneseHaitianHmongHonduranHopiHoumaHungarianIcelanderIndian (Asian)IndonesianInupiatIranianIraqiIrishIroquoisIsraeliItalianJamaicanJapaneseJordanianKenyanKiowaKoreanLaotianLatvianLebaneseLiberianLithuanianLumbeeLuxembourgerMacedonianMalaysianMalteseMarshalleseMenomineeMexicanMexican American IndianMongolianMoroccanNavajoNepaleseNew ZealanderNicaraguanNigerianNorthern EuropeanNorwegianOkinawanOsageOttawaPaiutePakistaniPalestinianPanamanianParaguayanPennsylvania GermanPeruvianPimaPolishPortuguesePotawatomiPuebloPuerto RicanPuget Sound SalishRomanianRussianSalvadoranSamoanScandinavianScotch-IrishScottishSeminoleSenegaleseSerbianShoshoneSierra LeoneanSiouxSlavicSlovakSloveneSomaliSouth AfricanSouth AmericanSouth American IndianSoviet UnionSpaniardSpanishSpanish AmericanSpanish American IndianSri LankanSubsaharan AfricanSudaneseSwedishSwissSyrianTaiwaneseThaiTlingit-HaidaTohono O'OdhamTonganTrinidadian and TobagonianTsimshianTurkishU.S. Virgin IslanderUgandanUkrainianUruguayanUteVenezuelanVietnameseWelshWest IndianYakamaYaquiYugoslavianYumanYup'ikZimbabwean
Immigration
NonimmigrantsImmigrantsAfghanistanAfricaAlbaniaArgentinaArmeniaAsiaAustraliaAustriaBahamasBangladeshBarbadosBelarusBelgiumBelizeBoliviaBosnia and HerzegovinaBrazilBulgariaBurma/MyanmarCabo VerdeCambodiaCameroonCanadaCaribbeanCentral AmericaChileChinaColombiaCongoCosta RicaCroatiaCubaCzechoslovakiaDenmarkDominicaDominican RepublicEastern AfricaEastern AsiaEastern EuropeEcuadorEgyptEl SalvadorEnglandEritreaEthiopiaEuropeFijiFranceGermanyGhanaGreeceGrenadaGuatemalaGuyanaHaitiHondurasHong KongHungaryIndiaIndonesiaIranIraqIrelandIsraelItalyJamaicaJapanJordanKazakhstanKenyaKoreaKuwaitLaosLatin AmericaLatviaLebanonLiberiaLithuaniaMalaysiaMexicoMicronesiaMiddle AfricaMoldovaMoroccoNepalNetherlandsNicaraguaNigeriaNorth AmericaNorth MacedoniaNorthern AfricaNorthern EuropeNorwayOceaniaPakistanPanamaPeruPhilippinesPolandPortugalRomaniaRussiaSaudi ArabiaScotlandSenegalSerbiaSierra LeoneSingaporeSomaliaSouth AfricaSouth AmericaSouth Central AsiaSouth Eastern AsiaSouthern EuropeSpainSri LankaSt. Vincent and the GrenadinesSudanSwedenSwitzerlandSyriaTaiwanThailandTrinidad and TobagoTurkeyUgandaUkraineUruguayUzbekistanVenezuelaVietnamWest IndiesWestern AfricaWestern AsiaWestern EuropeYemenZaireZimbabweAzores
In Labor Force | Age 35-44
Income
Poverty
Unemployment
Labor Participation
Family Structure
Vehicle Availability
Education Level
Disability

In Labor Force | Age 35-44 Comparison

Native Hawaiians

Mexicans

Tragic
Tragic
83.9%
IN LABOR FORCE | AGE 35-44
3.0/ 100
METRIC RATING
232nd/ 347
METRIC RANK
81.6%
IN LABOR FORCE | AGE 35-44
0.0/ 100
METRIC RATING
313th/ 347
METRIC RANK

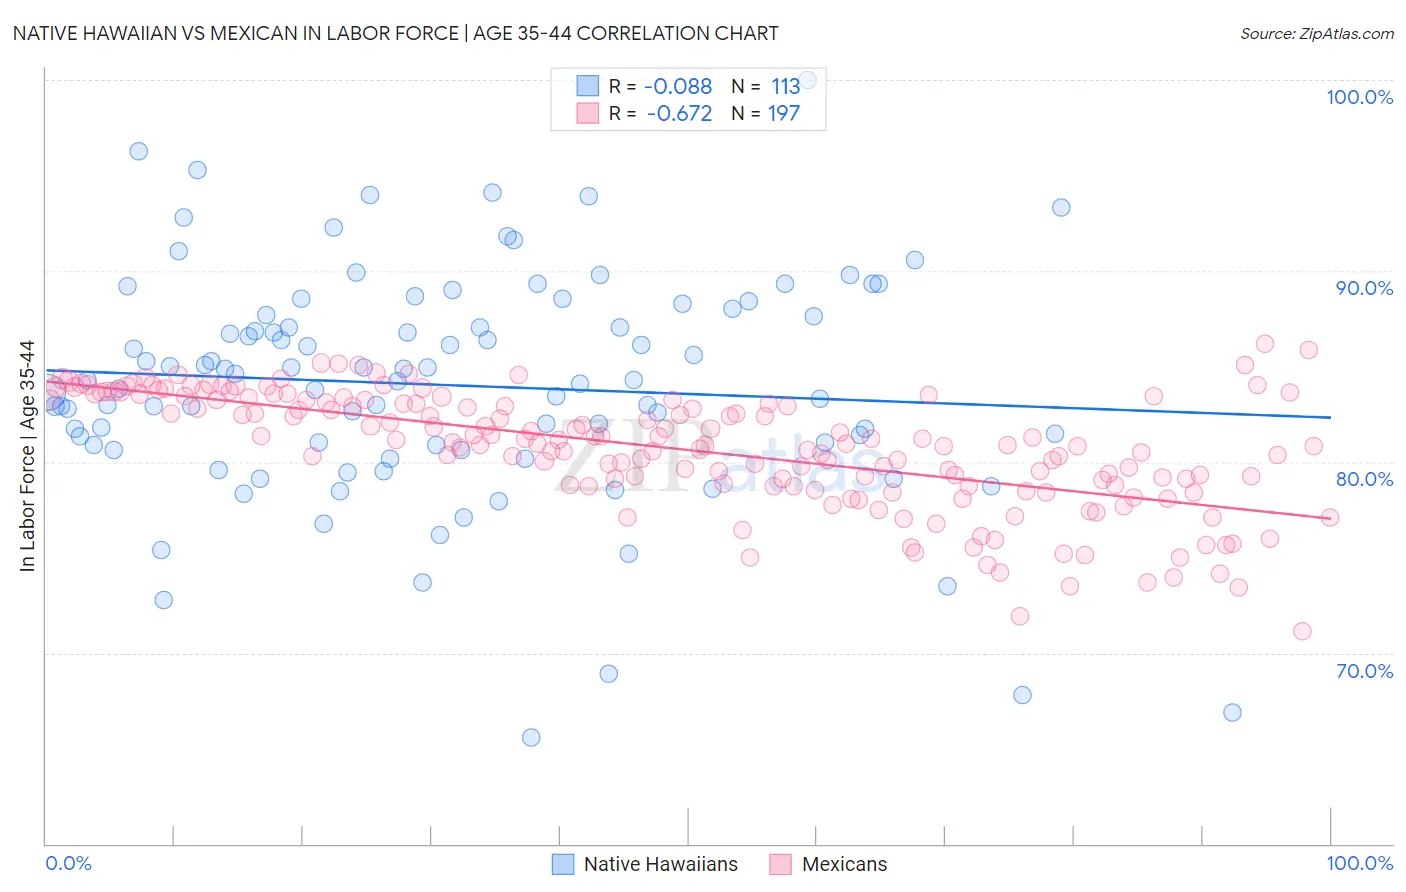
Native Hawaiian vs Mexican In Labor Force | Age 35-44 Correlation Chart

The statistical analysis conducted on geographies consisting of 331,970,144 people shows a slight negative correlation between the proportion of Native Hawaiians and labor force participation rate among population between the ages 35 and 44 in the United States with a correlation coefficient (R) of -0.088 and weighted average of 83.9%. Similarly, the statistical analysis conducted on geographies consisting of 564,555,689 people shows a significant negative correlation between the proportion of Mexicans and labor force participation rate among population between the ages 35 and 44 in the United States with a correlation coefficient (R) of -0.672 and weighted average of 81.6%, a difference of 2.8%.
Native Hawaiian vs Mexican In Labor Force | Age 35-44

In Labor Force | Age 35-44 Correlation Summary

MeasurementNative HawaiianMexican
Minimum65.6%71.1%
Maximum100.0%86.2%
Range34.4%15.0%
Mean84.0%80.7%
Median84.3%81.0%
Interquartile 25% (IQ1)80.9%78.8%
Interquartile 75% (IQ3)87.8%83.3%
Interquartile Range (IQR)7.0%4.5%
Standard Deviation (Sample)6.0%3.1%
Standard Deviation (Population)6.0%3.0%

Similar Demographics by In Labor Force | Age 35-44

Demographics Similar to Native Hawaiians by In Labor Force | Age 35-44

In terms of in labor force | age 35-44, the demographic groups most similar to Native Hawaiians are Scottish (83.9%, a difference of 0.010%), Immigrants from Germany (83.9%, a difference of 0.010%), Immigrants from Oceania (83.9%, a difference of 0.020%), Immigrants from Syria (83.9%, a difference of 0.030%), and Immigrants from Iraq (83.9%, a difference of 0.040%).
DemographicsRating | RankIn Labor Force | Age 35-44
Immigrants | Burma/Myanmar
6.1
/100
|
#225
Tragic
84.0%
Panamanians
5.4
/100
|
#226
Tragic
84.0%
British West Indians
5.3
/100
|
#227
Tragic
84.0%
Welsh
5.3
/100
|
#228
Tragic
84.0%
Immigrants | Thailand
4.7
/100
|
#229
Tragic
84.0%
Immigrants | Iraq
3.7
/100
|
#230
Tragic
83.9%
Scottish
3.2
/100
|
#231
Tragic
83.9%
Native Hawaiians
3.0
/100
|
#232
Tragic
83.9%
Immigrants | Germany
2.8
/100
|
#233
Tragic
83.9%
Immigrants | Oceania
2.6
/100
|
#234
Tragic
83.9%
Immigrants | Syria
2.5
/100
|
#235
Tragic
83.9%
West Indians
2.4
/100
|
#236
Tragic
83.9%
English
1.8
/100
|
#237
Tragic
83.8%
Immigrants | Laos
1.7
/100
|
#238
Tragic
83.8%
Celtics
1.4
/100
|
#239
Tragic
83.8%

Demographics Similar to Mexicans by In Labor Force | Age 35-44

In terms of in labor force | age 35-44, the demographic groups most similar to Mexicans are Alaska Native (81.6%, a difference of 0.0%), Cajun (81.5%, a difference of 0.11%), Immigrants from Mexico (81.5%, a difference of 0.14%), Colville (81.7%, a difference of 0.15%), and Comanche (81.5%, a difference of 0.16%).
DemographicsRating | RankIn Labor Force | Age 35-44
Blacks/African Americans
0.0
/100
|
#306
Tragic
82.2%
Hispanics or Latinos
0.0
/100
|
#307
Tragic
82.1%
Immigrants | Central America
0.0
/100
|
#308
Tragic
82.0%
Cree
0.0
/100
|
#309
Tragic
82.0%
Blackfeet
0.0
/100
|
#310
Tragic
81.9%
Colville
0.0
/100
|
#311
Tragic
81.7%
Alaska Natives
0.0
/100
|
#312
Tragic
81.6%
Mexicans
0.0
/100
|
#313
Tragic
81.6%
Cajuns
0.0
/100
|
#314
Tragic
81.5%
Immigrants | Mexico
0.0
/100
|
#315
Tragic
81.5%
Comanche
0.0
/100
|
#316
Tragic
81.5%
Cherokee
0.0
/100
|
#317
Tragic
81.4%
Alaskan Athabascans
0.0
/100
|
#318
Tragic
81.3%
Inupiat
0.0
/100
|
#319
Tragic
80.9%
Chickasaw
0.0
/100
|
#320
Tragic
80.9%