Native Hawaiian vs Romanian In Labor Force | Age 35-44
COMPARE
Native Hawaiian
Romanian
In Labor Force | Age 35-44
In Labor Force | Age 35-44 Comparison
Native Hawaiians
Romanians
83.9%
IN LABOR FORCE | AGE 35-44
3.0/ 100
METRIC RATING
232nd/ 347
METRIC RANK
84.5%
IN LABOR FORCE | AGE 35-44
72.1/ 100
METRIC RATING
151st/ 347
METRIC RANK
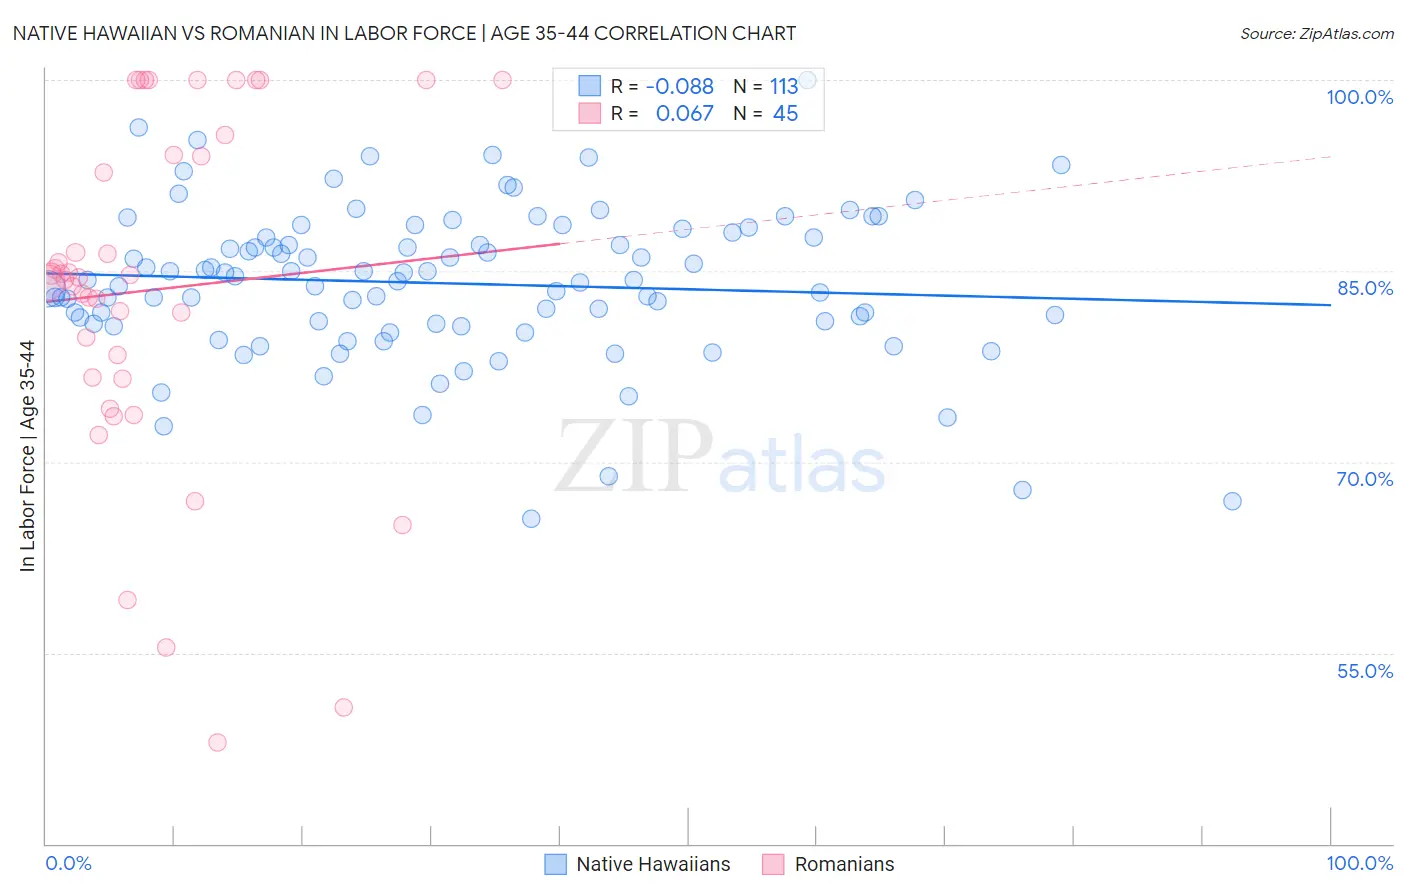
Native Hawaiian vs Romanian In Labor Force | Age 35-44 Correlation Chart
The statistical analysis conducted on geographies consisting of 331,970,144 people shows a slight negative correlation between the proportion of Native Hawaiians and labor force participation rate among population between the ages 35 and 44 in the United States with a correlation coefficient (R) of -0.088 and weighted average of 83.9%. Similarly, the statistical analysis conducted on geographies consisting of 377,740,706 people shows a slight positive correlation between the proportion of Romanians and labor force participation rate among population between the ages 35 and 44 in the United States with a correlation coefficient (R) of 0.067 and weighted average of 84.5%, a difference of 0.72%.
In Labor Force | Age 35-44 Correlation Summary
| Measurement | Native Hawaiian | Romanian |
| Minimum | 65.6% | 48.0% |
| Maximum | 100.0% | 100.0% |
| Range | 34.4% | 52.0% |
| Mean | 84.0% | 83.5% |
| Median | 84.3% | 84.5% |
| Interquartile 25% (IQ1) | 80.9% | 76.6% |
| Interquartile 75% (IQ3) | 87.8% | 94.9% |
| Interquartile Range (IQR) | 7.0% | 18.3% |
| Standard Deviation (Sample) | 6.0% | 13.6% |
| Standard Deviation (Population) | 6.0% | 13.4% |
Similar Demographics by In Labor Force | Age 35-44
Demographics Similar to Native Hawaiians by In Labor Force | Age 35-44
In terms of in labor force | age 35-44, the demographic groups most similar to Native Hawaiians are Scottish (83.9%, a difference of 0.010%), Immigrants from Germany (83.9%, a difference of 0.010%), Immigrants from Oceania (83.9%, a difference of 0.020%), Immigrants from Syria (83.9%, a difference of 0.030%), and Immigrants from Iraq (83.9%, a difference of 0.040%).
| Demographics | Rating | Rank | In Labor Force | Age 35-44 |
| Immigrants | Burma/Myanmar | 6.1 /100 | #225 | Tragic 84.0% |
| Panamanians | 5.4 /100 | #226 | Tragic 84.0% |
| British West Indians | 5.3 /100 | #227 | Tragic 84.0% |
| Welsh | 5.3 /100 | #228 | Tragic 84.0% |
| Immigrants | Thailand | 4.7 /100 | #229 | Tragic 84.0% |
| Immigrants | Iraq | 3.7 /100 | #230 | Tragic 83.9% |
| Scottish | 3.2 /100 | #231 | Tragic 83.9% |
| Native Hawaiians | 3.0 /100 | #232 | Tragic 83.9% |
| Immigrants | Germany | 2.8 /100 | #233 | Tragic 83.9% |
| Immigrants | Oceania | 2.6 /100 | #234 | Tragic 83.9% |
| Immigrants | Syria | 2.5 /100 | #235 | Tragic 83.9% |
| West Indians | 2.4 /100 | #236 | Tragic 83.9% |
| English | 1.8 /100 | #237 | Tragic 83.8% |
| Immigrants | Laos | 1.7 /100 | #238 | Tragic 83.8% |
| Celtics | 1.4 /100 | #239 | Tragic 83.8% |
Demographics Similar to Romanians by In Labor Force | Age 35-44
In terms of in labor force | age 35-44, the demographic groups most similar to Romanians are South American Indian (84.5%, a difference of 0.010%), Okinawan (84.5%, a difference of 0.010%), Immigrants from Nigeria (84.5%, a difference of 0.010%), Immigrants from Taiwan (84.5%, a difference of 0.010%), and Trinidadian and Tobagonian (84.5%, a difference of 0.020%).
| Demographics | Rating | Rank | In Labor Force | Age 35-44 |
| Immigrants | Jamaica | 79.4 /100 | #144 | Good 84.6% |
| Immigrants | Saudi Arabia | 79.4 /100 | #145 | Good 84.6% |
| Immigrants | Asia | 78.7 /100 | #146 | Good 84.5% |
| Immigrants | Netherlands | 76.6 /100 | #147 | Good 84.5% |
| South American Indians | 73.6 /100 | #148 | Good 84.5% |
| Okinawans | 73.5 /100 | #149 | Good 84.5% |
| Immigrants | Nigeria | 73.3 /100 | #150 | Good 84.5% |
| Romanians | 72.1 /100 | #151 | Good 84.5% |
| Immigrants | Taiwan | 71.4 /100 | #152 | Good 84.5% |
| Trinidadians and Tobagonians | 69.5 /100 | #153 | Good 84.5% |
| Iranians | 69.4 /100 | #154 | Good 84.5% |
| Immigrants | Switzerland | 65.9 /100 | #155 | Good 84.5% |
| Immigrants | Israel | 64.3 /100 | #156 | Good 84.4% |
| Immigrants | Austria | 63.8 /100 | #157 | Good 84.4% |
| Jamaicans | 62.7 /100 | #158 | Good 84.4% |