Asian vs Immigrants from Cambodia In Labor Force | Age 35-44
COMPARE
Asian
Immigrants from Cambodia
In Labor Force | Age 35-44
In Labor Force | Age 35-44 Comparison
Asians
Immigrants from Cambodia
84.7%
IN LABOR FORCE | AGE 35-44
90.6/ 100
METRIC RATING
126th/ 347
METRIC RANK
83.8%
IN LABOR FORCE | AGE 35-44
1.1/ 100
METRIC RATING
242nd/ 347
METRIC RANK
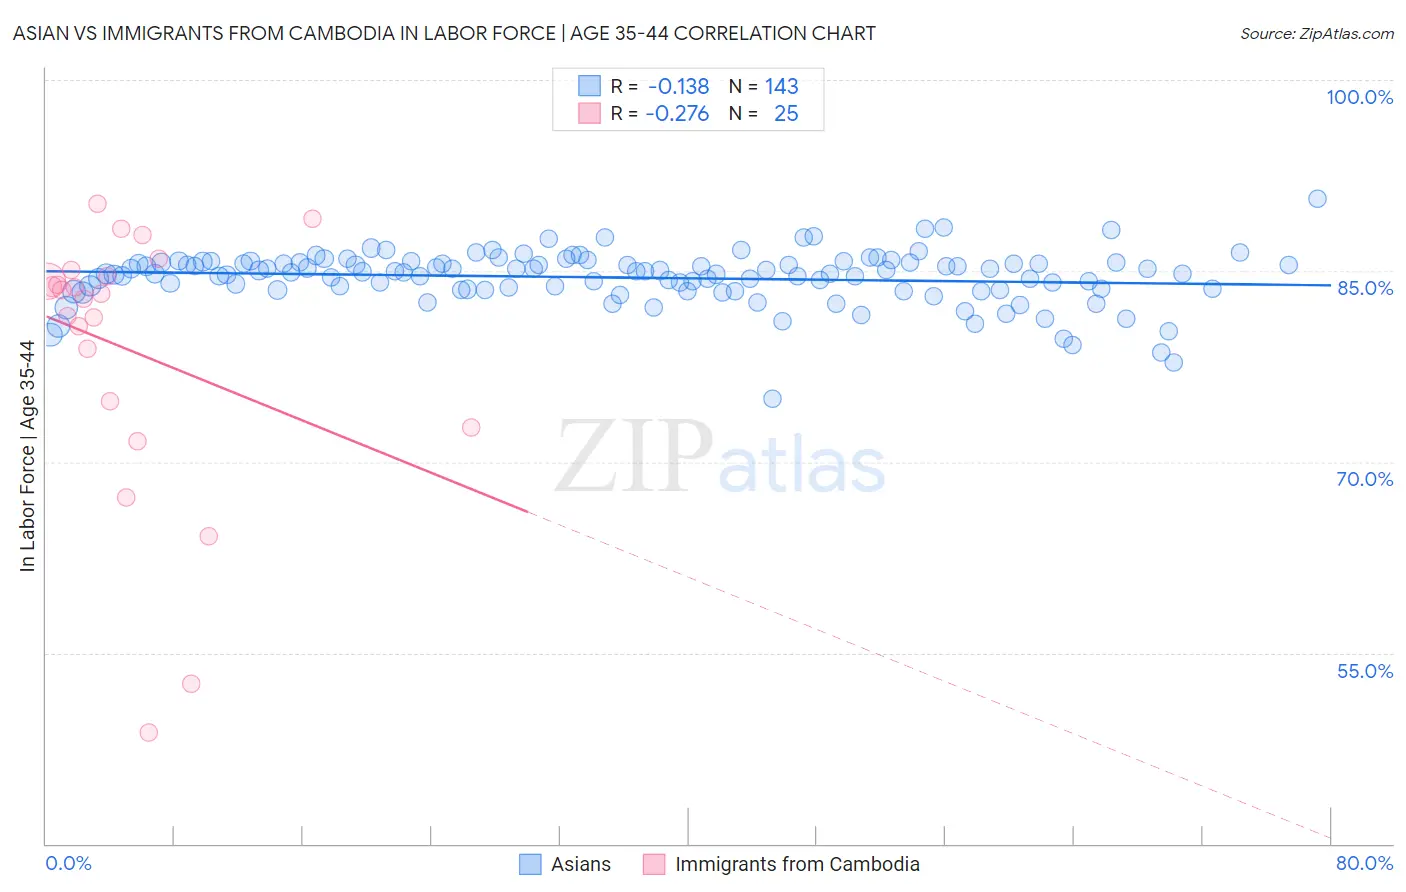
Asian vs Immigrants from Cambodia In Labor Force | Age 35-44 Correlation Chart
The statistical analysis conducted on geographies consisting of 550,310,951 people shows a poor negative correlation between the proportion of Asians and labor force participation rate among population between the ages 35 and 44 in the United States with a correlation coefficient (R) of -0.138 and weighted average of 84.7%. Similarly, the statistical analysis conducted on geographies consisting of 205,131,039 people shows a weak negative correlation between the proportion of Immigrants from Cambodia and labor force participation rate among population between the ages 35 and 44 in the United States with a correlation coefficient (R) of -0.276 and weighted average of 83.8%, a difference of 1.1%.
In Labor Force | Age 35-44 Correlation Summary
| Measurement | Asian | Immigrants from Cambodia |
| Minimum | 74.9% | 48.7% |
| Maximum | 90.7% | 90.3% |
| Range | 15.8% | 41.6% |
| Mean | 84.5% | 78.8% |
| Median | 84.9% | 83.2% |
| Interquartile 25% (IQ1) | 83.5% | 73.7% |
| Interquartile 75% (IQ3) | 85.6% | 84.8% |
| Interquartile Range (IQR) | 2.1% | 11.1% |
| Standard Deviation (Sample) | 2.1% | 10.7% |
| Standard Deviation (Population) | 2.1% | 10.5% |
Similar Demographics by In Labor Force | Age 35-44
Demographics Similar to Asians by In Labor Force | Age 35-44
In terms of in labor force | age 35-44, the demographic groups most similar to Asians are Slavic (84.7%, a difference of 0.0%), Maltese (84.7%, a difference of 0.0%), Immigrants from Spain (84.7%, a difference of 0.0%), Immigrants from Ghana (84.7%, a difference of 0.0%), and Finnish (84.7%, a difference of 0.010%).
| Demographics | Rating | Rank | In Labor Force | Age 35-44 |
| Burmese | 91.8 /100 | #119 | Exceptional 84.7% |
| Immigrants | Northern Europe | 91.5 /100 | #120 | Exceptional 84.7% |
| Finns | 91.2 /100 | #121 | Exceptional 84.7% |
| Germans | 91.0 /100 | #122 | Exceptional 84.7% |
| Immigrants | South America | 90.9 /100 | #123 | Exceptional 84.7% |
| Slavs | 90.8 /100 | #124 | Exceptional 84.7% |
| Maltese | 90.8 /100 | #125 | Exceptional 84.7% |
| Asians | 90.6 /100 | #126 | Exceptional 84.7% |
| Immigrants | Spain | 90.6 /100 | #127 | Exceptional 84.7% |
| Immigrants | Ghana | 90.4 /100 | #128 | Exceptional 84.7% |
| Palestinians | 89.7 /100 | #129 | Excellent 84.7% |
| Bhutanese | 89.7 /100 | #130 | Excellent 84.7% |
| Immigrants | Scotland | 89.6 /100 | #131 | Excellent 84.7% |
| Austrians | 89.4 /100 | #132 | Excellent 84.7% |
| Argentineans | 88.4 /100 | #133 | Excellent 84.6% |
Demographics Similar to Immigrants from Cambodia by In Labor Force | Age 35-44
In terms of in labor force | age 35-44, the demographic groups most similar to Immigrants from Cambodia are Immigrants from Western Asia (83.8%, a difference of 0.0%), Guyanese (83.8%, a difference of 0.010%), Malaysian (83.8%, a difference of 0.010%), Iraqi (83.8%, a difference of 0.020%), and Immigrants (83.7%, a difference of 0.020%).
| Demographics | Rating | Rank | In Labor Force | Age 35-44 |
| Immigrants | Syria | 2.5 /100 | #235 | Tragic 83.9% |
| West Indians | 2.4 /100 | #236 | Tragic 83.9% |
| English | 1.8 /100 | #237 | Tragic 83.8% |
| Immigrants | Laos | 1.7 /100 | #238 | Tragic 83.8% |
| Celtics | 1.4 /100 | #239 | Tragic 83.8% |
| Arabs | 1.3 /100 | #240 | Tragic 83.8% |
| Iraqis | 1.3 /100 | #241 | Tragic 83.8% |
| Immigrants | Cambodia | 1.1 /100 | #242 | Tragic 83.8% |
| Immigrants | Western Asia | 1.1 /100 | #243 | Tragic 83.8% |
| Guyanese | 1.1 /100 | #244 | Tragic 83.8% |
| Malaysians | 1.1 /100 | #245 | Tragic 83.8% |
| Immigrants | Immigrants | 1.0 /100 | #246 | Tragic 83.7% |
| Immigrants | Armenia | 0.9 /100 | #247 | Tragic 83.7% |
| Indonesians | 0.8 /100 | #248 | Tragic 83.7% |
| Immigrants | St. Vincent and the Grenadines | 0.7 /100 | #249 | Tragic 83.7% |