Mongolian vs Immigrants from Norway In Labor Force | Age 20-24
COMPARE
Mongolian
Immigrants from Norway
In Labor Force | Age 20-24
In Labor Force | Age 20-24 Comparison
Mongolians
Immigrants from Norway
73.3%
IN LABOR FORCE | AGE 20-24
0.2/ 100
METRIC RATING
276th/ 347
METRIC RANK
74.5%
IN LABOR FORCE | AGE 20-24
10.3/ 100
METRIC RATING
220th/ 347
METRIC RANK
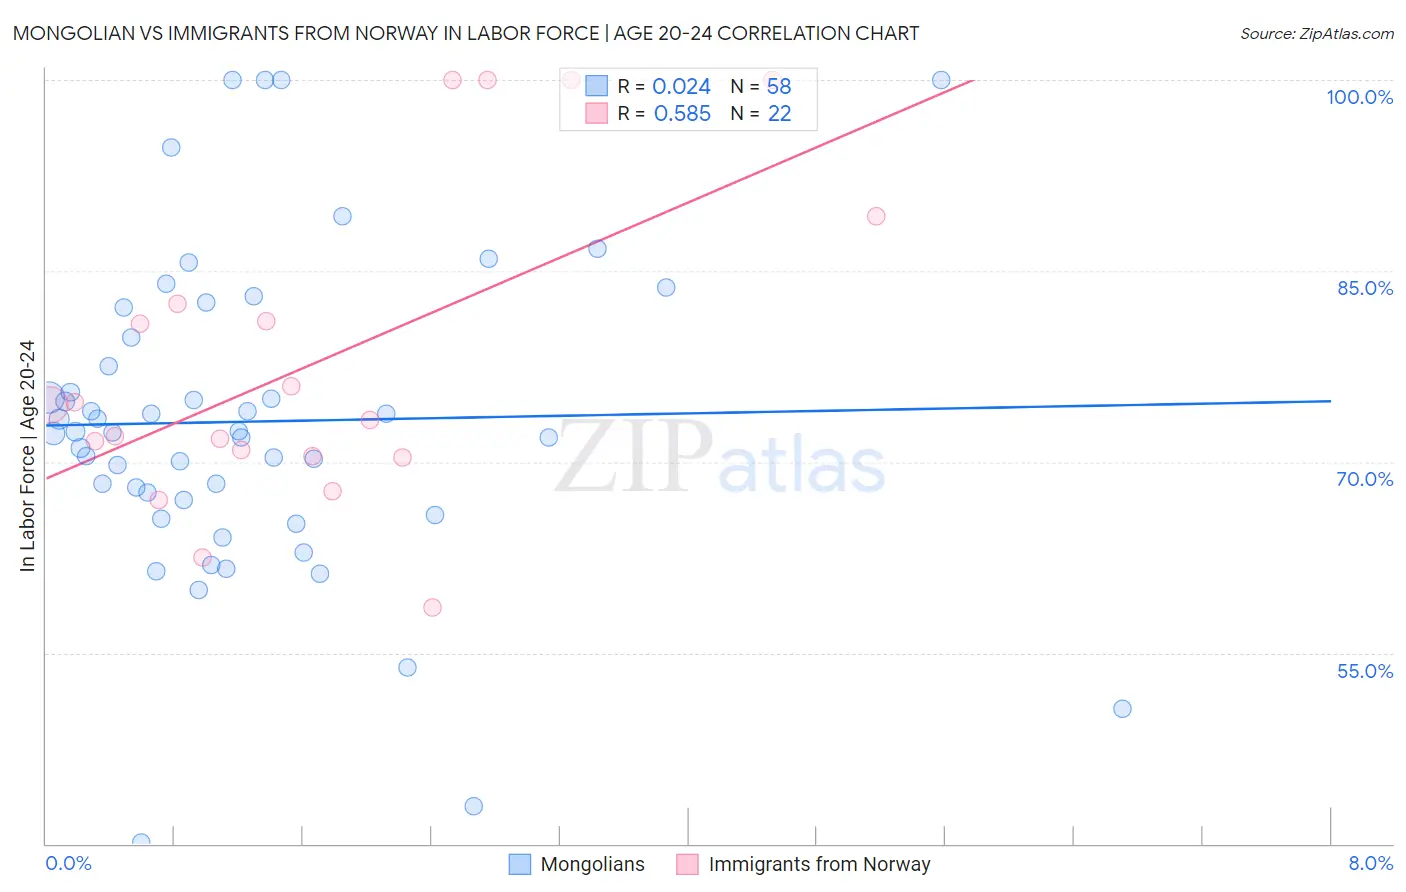
Mongolian vs Immigrants from Norway In Labor Force | Age 20-24 Correlation Chart
The statistical analysis conducted on geographies consisting of 140,358,526 people shows no correlation between the proportion of Mongolians and labor force participation rate among population between the ages 20 and 24 in the United States with a correlation coefficient (R) of 0.024 and weighted average of 73.3%. Similarly, the statistical analysis conducted on geographies consisting of 116,699,146 people shows a substantial positive correlation between the proportion of Immigrants from Norway and labor force participation rate among population between the ages 20 and 24 in the United States with a correlation coefficient (R) of 0.585 and weighted average of 74.5%, a difference of 1.5%.
In Labor Force | Age 20-24 Correlation Summary
| Measurement | Mongolian | Immigrants from Norway |
| Minimum | 40.1% | 58.6% |
| Maximum | 100.0% | 100.0% |
| Range | 59.9% | 41.4% |
| Mean | 73.2% | 77.9% |
| Median | 72.4% | 73.8% |
| Interquartile 25% (IQ1) | 67.0% | 70.5% |
| Interquartile 75% (IQ3) | 79.7% | 82.4% |
| Interquartile Range (IQR) | 12.8% | 11.9% |
| Standard Deviation (Sample) | 12.5% | 12.5% |
| Standard Deviation (Population) | 12.4% | 12.2% |
Similar Demographics by In Labor Force | Age 20-24
Demographics Similar to Mongolians by In Labor Force | Age 20-24
In terms of in labor force | age 20-24, the demographic groups most similar to Mongolians are Immigrants from South America (73.3%, a difference of 0.010%), Immigrants from Malaysia (73.3%, a difference of 0.010%), Cypriot (73.3%, a difference of 0.030%), Venezuelan (73.3%, a difference of 0.030%), and Immigrants from Colombia (73.4%, a difference of 0.070%).
| Demographics | Rating | Rank | In Labor Force | Age 20-24 |
| Colombians | 0.3 /100 | #269 | Tragic 73.5% |
| Immigrants | Russia | 0.3 /100 | #270 | Tragic 73.5% |
| Immigrants | Indonesia | 0.3 /100 | #271 | Tragic 73.4% |
| Belizeans | 0.3 /100 | #272 | Tragic 73.4% |
| Cheyenne | 0.2 /100 | #273 | Tragic 73.4% |
| Immigrants | Colombia | 0.2 /100 | #274 | Tragic 73.4% |
| Immigrants | South America | 0.2 /100 | #275 | Tragic 73.3% |
| Mongolians | 0.2 /100 | #276 | Tragic 73.3% |
| Immigrants | Malaysia | 0.2 /100 | #277 | Tragic 73.3% |
| Cypriots | 0.2 /100 | #278 | Tragic 73.3% |
| Venezuelans | 0.2 /100 | #279 | Tragic 73.3% |
| Bahamians | 0.1 /100 | #280 | Tragic 73.3% |
| Immigrants | Venezuela | 0.1 /100 | #281 | Tragic 73.2% |
| Immigrants | Spain | 0.1 /100 | #282 | Tragic 73.2% |
| Immigrants | Bahamas | 0.1 /100 | #283 | Tragic 73.2% |
Demographics Similar to Immigrants from Norway by In Labor Force | Age 20-24
In terms of in labor force | age 20-24, the demographic groups most similar to Immigrants from Norway are Chickasaw (74.5%, a difference of 0.0%), Immigrants from Peru (74.5%, a difference of 0.010%), Nepalese (74.5%, a difference of 0.010%), Immigrants from India (74.4%, a difference of 0.020%), and Chilean (74.5%, a difference of 0.080%).
| Demographics | Rating | Rank | In Labor Force | Age 20-24 |
| Peruvians | 13.3 /100 | #213 | Poor 74.5% |
| Immigrants | Southern Europe | 13.2 /100 | #214 | Poor 74.5% |
| Immigrants | Ghana | 12.7 /100 | #215 | Poor 74.5% |
| Immigrants | Kuwait | 12.7 /100 | #216 | Poor 74.5% |
| Chileans | 12.5 /100 | #217 | Poor 74.5% |
| Immigrants | Peru | 10.6 /100 | #218 | Poor 74.5% |
| Nepalese | 10.5 /100 | #219 | Poor 74.5% |
| Immigrants | Norway | 10.3 /100 | #220 | Poor 74.5% |
| Chickasaw | 10.3 /100 | #221 | Poor 74.5% |
| Immigrants | India | 9.9 /100 | #222 | Tragic 74.4% |
| Hispanics or Latinos | 7.9 /100 | #223 | Tragic 74.4% |
| Seminole | 6.9 /100 | #224 | Tragic 74.3% |
| Ghanaians | 6.2 /100 | #225 | Tragic 74.3% |
| Immigrants | Fiji | 5.9 /100 | #226 | Tragic 74.3% |
| Immigrants | Ireland | 5.8 /100 | #227 | Tragic 74.3% |