Immigrants from France vs Irish In Labor Force | Age 20-24
COMPARE
Immigrants from France
Irish
In Labor Force | Age 20-24
In Labor Force | Age 20-24 Comparison
Immigrants from France
Irish
74.1%
IN LABOR FORCE | AGE 20-24
3.3/ 100
METRIC RATING
236th/ 347
METRIC RANK
77.4%
IN LABOR FORCE | AGE 20-24
100.0/ 100
METRIC RATING
39th/ 347
METRIC RANK
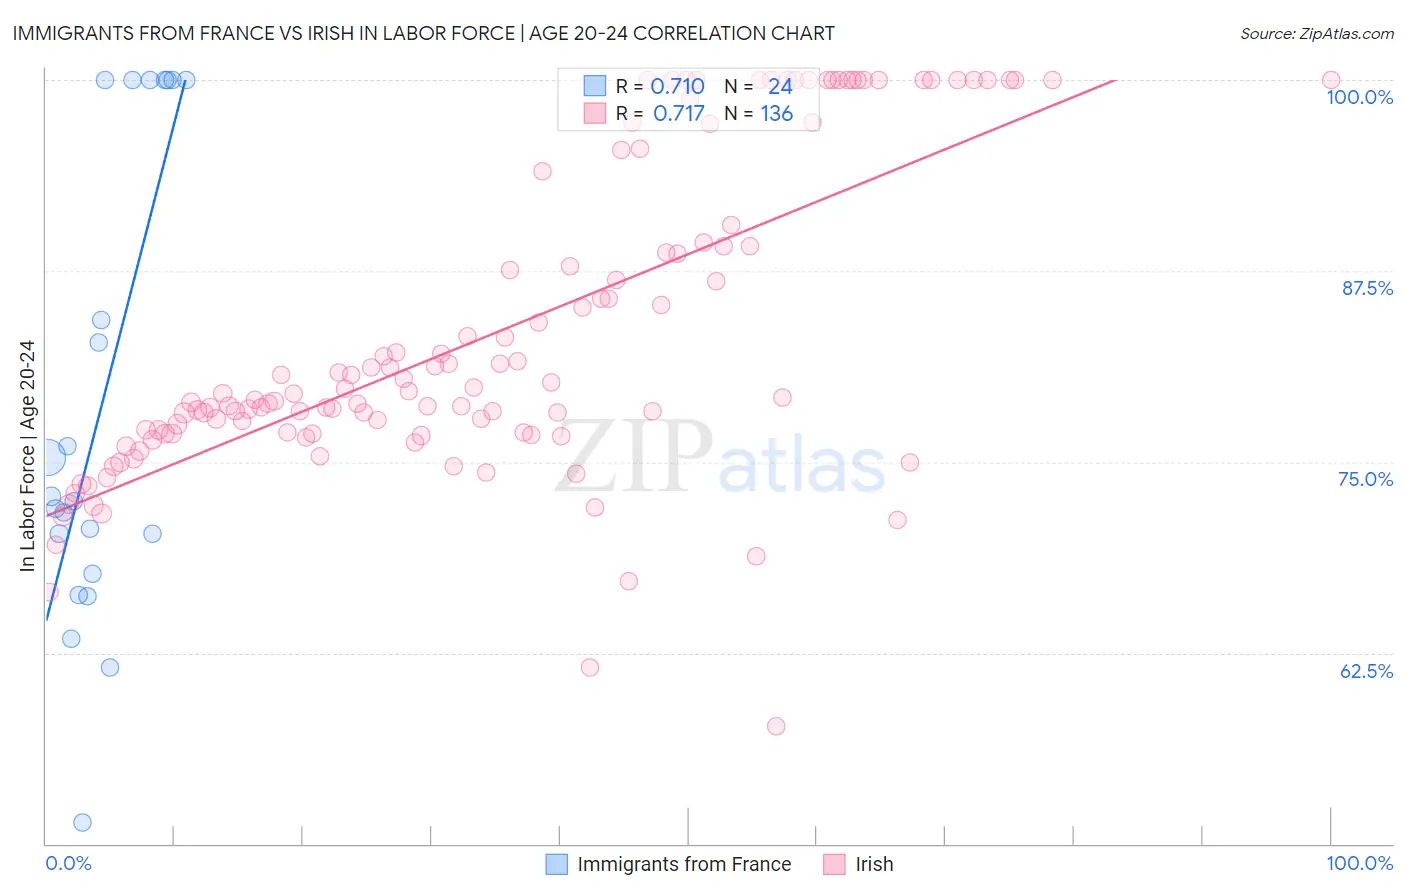
Immigrants from France vs Irish In Labor Force | Age 20-24 Correlation Chart
The statistical analysis conducted on geographies consisting of 287,788,278 people shows a strong positive correlation between the proportion of Immigrants from France and labor force participation rate among population between the ages 20 and 24 in the United States with a correlation coefficient (R) of 0.710 and weighted average of 74.1%. Similarly, the statistical analysis conducted on geographies consisting of 578,188,051 people shows a strong positive correlation between the proportion of Irish and labor force participation rate among population between the ages 20 and 24 in the United States with a correlation coefficient (R) of 0.717 and weighted average of 77.4%, a difference of 4.4%.
In Labor Force | Age 20-24 Correlation Summary
| Measurement | Immigrants from France | Irish |
| Minimum | 51.4% | 57.7% |
| Maximum | 100.0% | 100.0% |
| Range | 48.6% | 42.3% |
| Mean | 79.0% | 83.4% |
| Median | 72.6% | 79.5% |
| Interquartile 25% (IQ1) | 69.0% | 76.9% |
| Interquartile 75% (IQ3) | 100.0% | 89.9% |
| Interquartile Range (IQR) | 31.0% | 13.1% |
| Standard Deviation (Sample) | 15.2% | 10.2% |
| Standard Deviation (Population) | 14.9% | 10.2% |
Similar Demographics by In Labor Force | Age 20-24
Demographics Similar to Immigrants from France by In Labor Force | Age 20-24
In terms of in labor force | age 20-24, the demographic groups most similar to Immigrants from France are Bermudan (74.1%, a difference of 0.010%), Laotian (74.1%, a difference of 0.020%), Immigrants (74.1%, a difference of 0.030%), Immigrants from Chile (74.1%, a difference of 0.040%), and Immigrants from Japan (74.1%, a difference of 0.040%).
| Demographics | Rating | Rank | In Labor Force | Age 20-24 |
| Immigrants | Sweden | 4.6 /100 | #229 | Tragic 74.2% |
| Immigrants | Albania | 4.3 /100 | #230 | Tragic 74.2% |
| Immigrants | Greece | 4.1 /100 | #231 | Tragic 74.2% |
| Immigrants | Switzerland | 4.1 /100 | #232 | Tragic 74.2% |
| Immigrants | Chile | 3.7 /100 | #233 | Tragic 74.1% |
| Immigrants | Immigrants | 3.6 /100 | #234 | Tragic 74.1% |
| Laotians | 3.5 /100 | #235 | Tragic 74.1% |
| Immigrants | France | 3.3 /100 | #236 | Tragic 74.1% |
| Bermudans | 3.2 /100 | #237 | Tragic 74.1% |
| Immigrants | Japan | 3.0 /100 | #238 | Tragic 74.1% |
| Immigrants | Latin America | 2.7 /100 | #239 | Tragic 74.1% |
| Immigrants | Sri Lanka | 2.3 /100 | #240 | Tragic 74.0% |
| Immigrants | Senegal | 2.1 /100 | #241 | Tragic 74.0% |
| Thais | 2.1 /100 | #242 | Tragic 74.0% |
| Immigrants | Syria | 1.9 /100 | #243 | Tragic 74.0% |
Demographics Similar to Irish by In Labor Force | Age 20-24
In terms of in labor force | age 20-24, the demographic groups most similar to Irish are Marshallese (77.4%, a difference of 0.030%), Scottish (77.4%, a difference of 0.030%), Immigrants from Congo (77.4%, a difference of 0.040%), French (77.4%, a difference of 0.050%), and Immigrants from Laos (77.4%, a difference of 0.060%).
| Demographics | Rating | Rank | In Labor Force | Age 20-24 |
| English | 100.0 /100 | #32 | Exceptional 77.6% |
| Immigrants | Ethiopia | 100.0 /100 | #33 | Exceptional 77.5% |
| German Russians | 100.0 /100 | #34 | Exceptional 77.5% |
| Immigrants | Eastern Africa | 100.0 /100 | #35 | Exceptional 77.5% |
| Welsh | 100.0 /100 | #36 | Exceptional 77.5% |
| Czechoslovakians | 100.0 /100 | #37 | Exceptional 77.5% |
| Marshallese | 100.0 /100 | #38 | Exceptional 77.4% |
| Irish | 100.0 /100 | #39 | Exceptional 77.4% |
| Scottish | 100.0 /100 | #40 | Exceptional 77.4% |
| Immigrants | Congo | 100.0 /100 | #41 | Exceptional 77.4% |
| French | 100.0 /100 | #42 | Exceptional 77.4% |
| Immigrants | Laos | 100.0 /100 | #43 | Exceptional 77.4% |
| Fijians | 100.0 /100 | #44 | Exceptional 77.4% |
| Native Hawaiians | 100.0 /100 | #45 | Exceptional 77.4% |
| Samoans | 100.0 /100 | #46 | Exceptional 77.4% |