Colombian vs Immigrants from Belgium In Labor Force | Age 20-24
COMPARE
Colombian
Immigrants from Belgium
In Labor Force | Age 20-24
In Labor Force | Age 20-24 Comparison
Colombians
Immigrants from Belgium
73.5%
IN LABOR FORCE | AGE 20-24
0.3/ 100
METRIC RATING
269th/ 347
METRIC RANK
73.9%
IN LABOR FORCE | AGE 20-24
1.3/ 100
METRIC RATING
250th/ 347
METRIC RANK
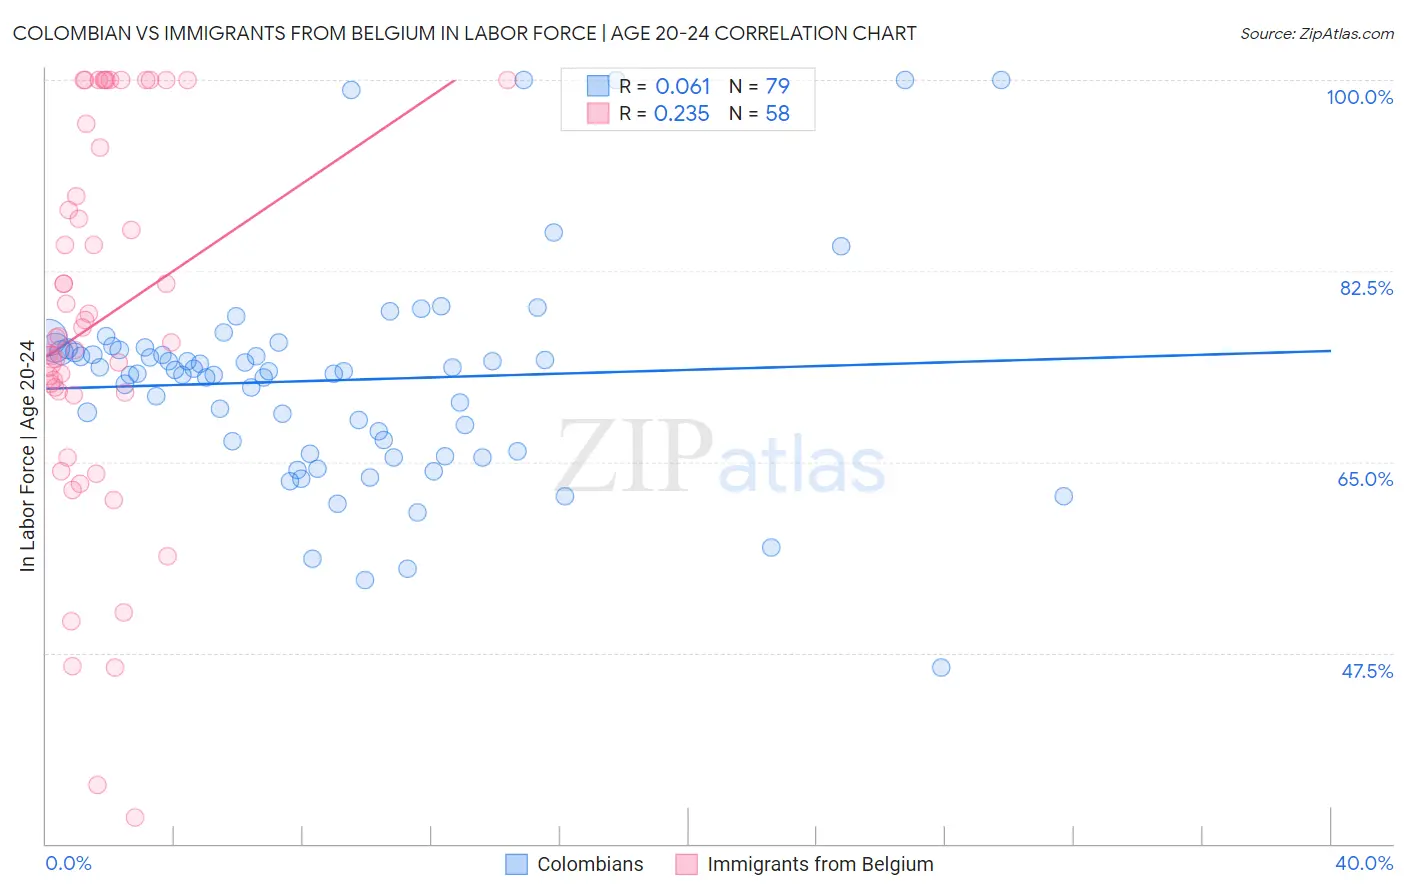
Colombian vs Immigrants from Belgium In Labor Force | Age 20-24 Correlation Chart
The statistical analysis conducted on geographies consisting of 419,536,889 people shows a slight positive correlation between the proportion of Colombians and labor force participation rate among population between the ages 20 and 24 in the United States with a correlation coefficient (R) of 0.061 and weighted average of 73.5%. Similarly, the statistical analysis conducted on geographies consisting of 146,712,766 people shows a weak positive correlation between the proportion of Immigrants from Belgium and labor force participation rate among population between the ages 20 and 24 in the United States with a correlation coefficient (R) of 0.235 and weighted average of 73.9%, a difference of 0.49%.
In Labor Force | Age 20-24 Correlation Summary
| Measurement | Colombian | Immigrants from Belgium |
| Minimum | 46.2% | 32.4% |
| Maximum | 100.0% | 100.0% |
| Range | 53.8% | 67.6% |
| Mean | 72.5% | 77.9% |
| Median | 73.3% | 76.4% |
| Interquartile 25% (IQ1) | 66.0% | 71.4% |
| Interquartile 75% (IQ3) | 75.4% | 93.8% |
| Interquartile Range (IQR) | 9.4% | 22.4% |
| Standard Deviation (Sample) | 9.9% | 17.2% |
| Standard Deviation (Population) | 9.8% | 17.1% |
Demographics Similar to Colombians and Immigrants from Belgium by In Labor Force | Age 20-24
In terms of in labor force | age 20-24, the demographic groups most similar to Colombians are South American (73.5%, a difference of 0.030%), Immigrants from Western Asia (73.5%, a difference of 0.080%), Burmese (73.6%, a difference of 0.12%), Haitian (73.6%, a difference of 0.12%), and Immigrants from Haiti (73.6%, a difference of 0.13%). Similarly, the demographic groups most similar to Immigrants from Belgium are Black/African American (73.9%, a difference of 0.0%), Immigrants from Egypt (73.8%, a difference of 0.020%), Immigrants from Kazakhstan (73.8%, a difference of 0.040%), Arapaho (73.8%, a difference of 0.090%), and Ute (73.8%, a difference of 0.090%).
| Demographics | Rating | Rank | In Labor Force | Age 20-24 |
| Blacks/African Americans | 1.3 /100 | #249 | Tragic 73.9% |
| Immigrants | Belgium | 1.3 /100 | #250 | Tragic 73.9% |
| Immigrants | Egypt | 1.2 /100 | #251 | Tragic 73.8% |
| Immigrants | Kazakhstan | 1.1 /100 | #252 | Tragic 73.8% |
| Arapaho | 1.0 /100 | #253 | Tragic 73.8% |
| Ute | 1.0 /100 | #254 | Tragic 73.8% |
| Immigrants | Pakistan | 0.9 /100 | #255 | Tragic 73.8% |
| Spanish American Indians | 0.8 /100 | #256 | Tragic 73.7% |
| Paraguayans | 0.8 /100 | #257 | Tragic 73.7% |
| Egyptians | 0.7 /100 | #258 | Tragic 73.7% |
| Dutch West Indians | 0.7 /100 | #259 | Tragic 73.7% |
| Immigrants | Turkey | 0.7 /100 | #260 | Tragic 73.7% |
| Houma | 0.6 /100 | #261 | Tragic 73.7% |
| Asians | 0.6 /100 | #262 | Tragic 73.7% |
| Immigrants | Asia | 0.5 /100 | #263 | Tragic 73.6% |
| Immigrants | Haiti | 0.5 /100 | #264 | Tragic 73.6% |
| Burmese | 0.5 /100 | #265 | Tragic 73.6% |
| Haitians | 0.5 /100 | #266 | Tragic 73.6% |
| Immigrants | Western Asia | 0.4 /100 | #267 | Tragic 73.5% |
| South Americans | 0.4 /100 | #268 | Tragic 73.5% |
| Colombians | 0.3 /100 | #269 | Tragic 73.5% |