Immigrants from Nepal vs Crow In Labor Force | Age 30-34
COMPARE
Immigrants from Nepal
Crow
In Labor Force | Age 30-34
In Labor Force | Age 30-34 Comparison
Immigrants from Nepal
Crow
85.6%
IN LABOR FORCE | AGE 30-34
99.8/ 100
METRIC RATING
45th/ 347
METRIC RANK
75.9%
IN LABOR FORCE | AGE 30-34
0.0/ 100
METRIC RATING
346th/ 347
METRIC RANK
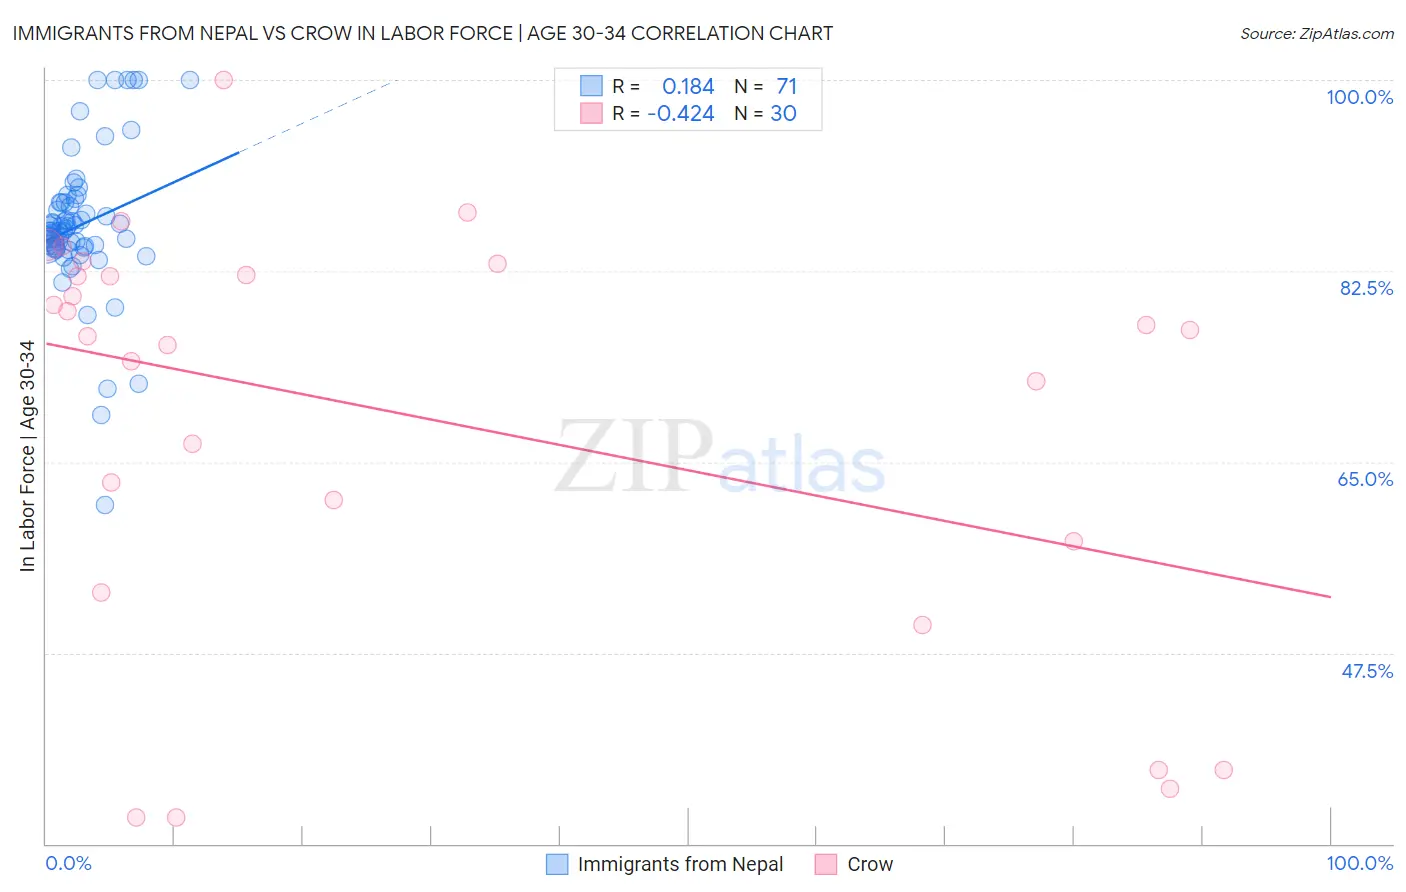
Immigrants from Nepal vs Crow In Labor Force | Age 30-34 Correlation Chart
The statistical analysis conducted on geographies consisting of 186,729,132 people shows a poor positive correlation between the proportion of Immigrants from Nepal and labor force participation rate among population between the ages 30 and 34 in the United States with a correlation coefficient (R) of 0.184 and weighted average of 85.6%. Similarly, the statistical analysis conducted on geographies consisting of 59,195,148 people shows a moderate negative correlation between the proportion of Crow and labor force participation rate among population between the ages 30 and 34 in the United States with a correlation coefficient (R) of -0.424 and weighted average of 75.9%, a difference of 12.8%.
In Labor Force | Age 30-34 Correlation Summary
| Measurement | Immigrants from Nepal | Crow |
| Minimum | 61.0% | 32.4% |
| Maximum | 100.0% | 100.0% |
| Range | 39.0% | 67.6% |
| Mean | 86.7% | 69.1% |
| Median | 86.2% | 76.8% |
| Interquartile 25% (IQ1) | 84.7% | 57.7% |
| Interquartile 75% (IQ3) | 88.7% | 82.1% |
| Interquartile Range (IQR) | 4.1% | 24.4% |
| Standard Deviation (Sample) | 6.7% | 19.0% |
| Standard Deviation (Population) | 6.6% | 18.6% |
Similar Demographics by In Labor Force | Age 30-34
Demographics Similar to Immigrants from Nepal by In Labor Force | Age 30-34
In terms of in labor force | age 30-34, the demographic groups most similar to Immigrants from Nepal are Immigrants from Sri Lanka (85.6%, a difference of 0.010%), Immigrants from Morocco (85.6%, a difference of 0.010%), Croatian (85.6%, a difference of 0.010%), Immigrants from Lithuania (85.6%, a difference of 0.030%), and Immigrants from Sweden (85.6%, a difference of 0.030%).
| Demographics | Rating | Rank | In Labor Force | Age 30-34 |
| Immigrants | Greece | 99.9 /100 | #38 | Exceptional 85.7% |
| Eastern Europeans | 99.9 /100 | #39 | Exceptional 85.7% |
| Turks | 99.9 /100 | #40 | Exceptional 85.7% |
| Immigrants | Italy | 99.9 /100 | #41 | Exceptional 85.7% |
| Zimbabweans | 99.8 /100 | #42 | Exceptional 85.6% |
| Immigrants | Lithuania | 99.8 /100 | #43 | Exceptional 85.6% |
| Immigrants | Sri Lanka | 99.8 /100 | #44 | Exceptional 85.6% |
| Immigrants | Nepal | 99.8 /100 | #45 | Exceptional 85.6% |
| Immigrants | Morocco | 99.8 /100 | #46 | Exceptional 85.6% |
| Croatians | 99.8 /100 | #47 | Exceptional 85.6% |
| Immigrants | Sweden | 99.8 /100 | #48 | Exceptional 85.6% |
| Lithuanians | 99.8 /100 | #49 | Exceptional 85.6% |
| Immigrants | Australia | 99.8 /100 | #50 | Exceptional 85.6% |
| Cape Verdeans | 99.7 /100 | #51 | Exceptional 85.6% |
| Slovenes | 99.7 /100 | #52 | Exceptional 85.6% |
Demographics Similar to Crow by In Labor Force | Age 30-34
In terms of in labor force | age 30-34, the demographic groups most similar to Crow are Yup'ik (76.4%, a difference of 0.68%), Yuman (77.1%, a difference of 1.5%), Lumbee (77.3%, a difference of 1.8%), Tohono O'odham (77.7%, a difference of 2.4%), and Navajo (73.8%, a difference of 2.9%).
| Demographics | Rating | Rank | In Labor Force | Age 30-34 |
| Inupiat | 0.0 /100 | #333 | Tragic 79.7% |
| Hopi | 0.0 /100 | #334 | Tragic 79.3% |
| Marshallese | 0.0 /100 | #335 | Tragic 79.2% |
| Natives/Alaskans | 0.0 /100 | #336 | Tragic 79.2% |
| Yakama | 0.0 /100 | #337 | Tragic 79.1% |
| Pima | 0.0 /100 | #338 | Tragic 79.0% |
| Apache | 0.0 /100 | #339 | Tragic 79.0% |
| Ute | 0.0 /100 | #340 | Tragic 78.9% |
| Immigrants | Yemen | 0.0 /100 | #341 | Tragic 78.2% |
| Tohono O'odham | 0.0 /100 | #342 | Tragic 77.7% |
| Lumbee | 0.0 /100 | #343 | Tragic 77.3% |
| Yuman | 0.0 /100 | #344 | Tragic 77.1% |
| Yup'ik | 0.0 /100 | #345 | Tragic 76.4% |
| Crow | 0.0 /100 | #346 | Tragic 75.9% |
| Navajo | 0.0 /100 | #347 | Tragic 73.8% |