Icelander vs Swiss In Labor Force | Age 20-64
COMPARE
Icelander
Swiss
In Labor Force | Age 20-64
In Labor Force | Age 20-64 Comparison
Icelanders
Swiss
79.7%
IN LABOR FORCE | AGE 20-64
75.1/ 100
METRIC RATING
149th/ 347
METRIC RANK
79.4%
IN LABOR FORCE | AGE 20-64
28.9/ 100
METRIC RATING
191st/ 347
METRIC RANK
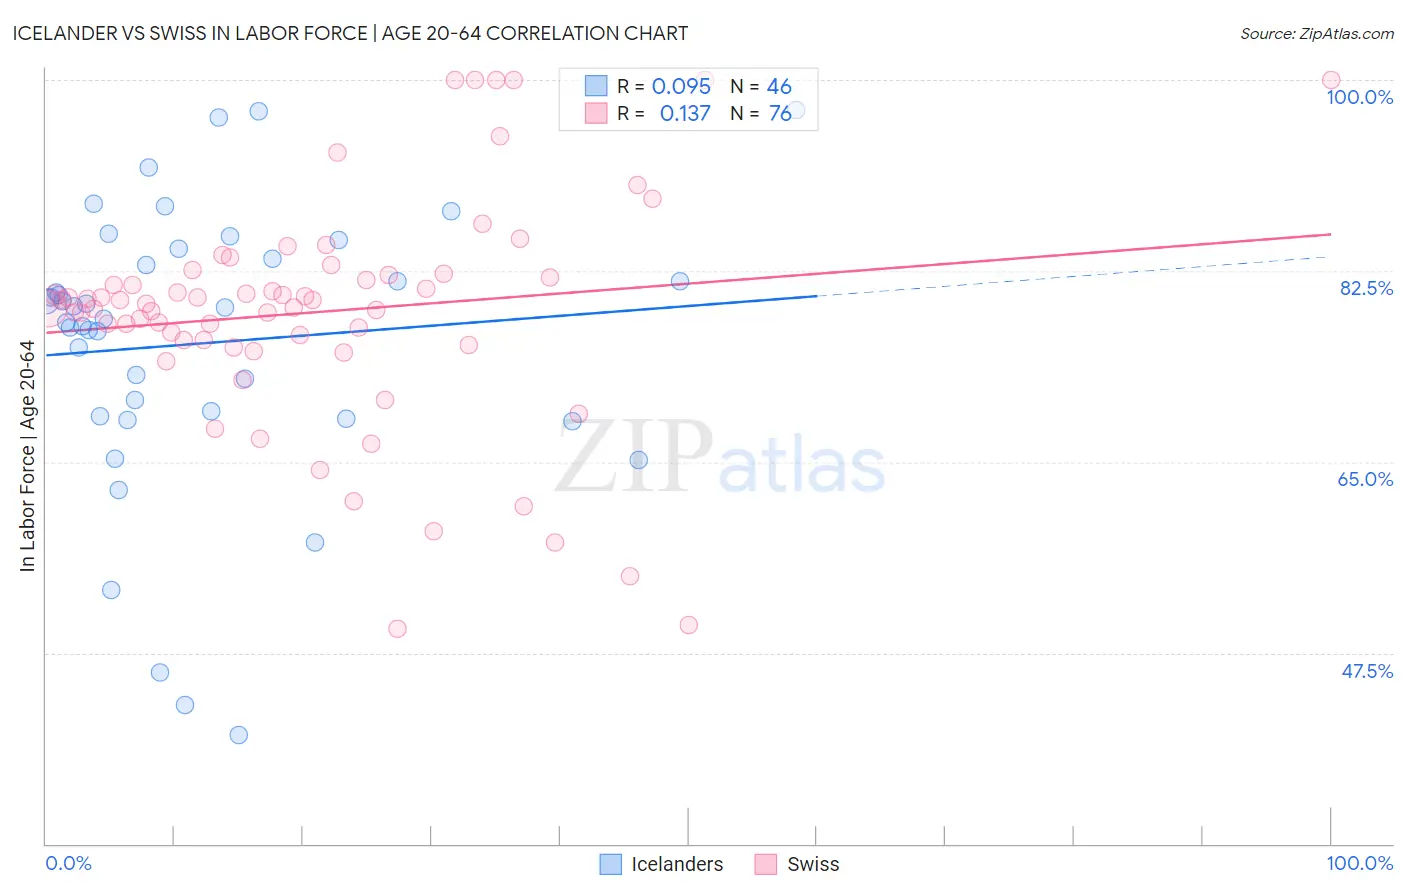
Icelander vs Swiss In Labor Force | Age 20-64 Correlation Chart
The statistical analysis conducted on geographies consisting of 159,668,592 people shows a slight positive correlation between the proportion of Icelanders and labor force participation rate among population between the ages 20 and 64 in the United States with a correlation coefficient (R) of 0.095 and weighted average of 79.7%. Similarly, the statistical analysis conducted on geographies consisting of 465,041,286 people shows a poor positive correlation between the proportion of Swiss and labor force participation rate among population between the ages 20 and 64 in the United States with a correlation coefficient (R) of 0.137 and weighted average of 79.4%, a difference of 0.40%.
In Labor Force | Age 20-64 Correlation Summary
| Measurement | Icelander | Swiss |
| Minimum | 40.0% | 49.7% |
| Maximum | 97.2% | 100.0% |
| Range | 57.2% | 50.3% |
| Mean | 75.9% | 78.8% |
| Median | 78.6% | 79.6% |
| Interquartile 25% (IQ1) | 69.2% | 76.0% |
| Interquartile 75% (IQ3) | 83.6% | 82.2% |
| Interquartile Range (IQR) | 14.4% | 6.2% |
| Standard Deviation (Sample) | 13.0% | 10.6% |
| Standard Deviation (Population) | 12.8% | 10.5% |
Similar Demographics by In Labor Force | Age 20-64
Demographics Similar to Icelanders by In Labor Force | Age 20-64
In terms of in labor force | age 20-64, the demographic groups most similar to Icelanders are Immigrants from Philippines (79.8%, a difference of 0.030%), Romanian (79.8%, a difference of 0.030%), Costa Rican (79.7%, a difference of 0.030%), Scandinavian (79.7%, a difference of 0.030%), and Immigrants from Northern Europe (79.7%, a difference of 0.030%).
| Demographics | Rating | Rank | In Labor Force | Age 20-64 |
| Slovaks | 79.9 /100 | #142 | Good 79.8% |
| Immigrants | Sweden | 79.7 /100 | #143 | Good 79.8% |
| Koreans | 79.6 /100 | #144 | Good 79.8% |
| Pakistanis | 79.3 /100 | #145 | Good 79.8% |
| Immigrants | Southern Europe | 78.9 /100 | #146 | Good 79.8% |
| Immigrants | Philippines | 78.0 /100 | #147 | Good 79.8% |
| Romanians | 77.6 /100 | #148 | Good 79.8% |
| Icelanders | 75.1 /100 | #149 | Good 79.7% |
| Costa Ricans | 72.4 /100 | #150 | Good 79.7% |
| Scandinavians | 72.0 /100 | #151 | Good 79.7% |
| Immigrants | Northern Europe | 72.0 /100 | #152 | Good 79.7% |
| Immigrants | Kazakhstan | 69.5 /100 | #153 | Good 79.7% |
| New Zealanders | 69.4 /100 | #154 | Good 79.7% |
| Immigrants | South Africa | 69.2 /100 | #155 | Good 79.7% |
| Senegalese | 69.1 /100 | #156 | Good 79.7% |
Demographics Similar to Swiss by In Labor Force | Age 20-64
In terms of in labor force | age 20-64, the demographic groups most similar to Swiss are Immigrants from El Salvador (79.4%, a difference of 0.020%), Immigrants from Syria (79.4%, a difference of 0.020%), Immigrants from Denmark (79.4%, a difference of 0.020%), Immigrants from Haiti (79.4%, a difference of 0.030%), and Indonesian (79.4%, a difference of 0.030%).
| Demographics | Rating | Rank | In Labor Force | Age 20-64 |
| Finns | 35.9 /100 | #184 | Fair 79.5% |
| Israelis | 34.7 /100 | #185 | Fair 79.5% |
| Northern Europeans | 34.5 /100 | #186 | Fair 79.5% |
| Assyrians/Chaldeans/Syriacs | 33.3 /100 | #187 | Fair 79.4% |
| Immigrants | Haiti | 32.1 /100 | #188 | Fair 79.4% |
| Immigrants | El Salvador | 30.9 /100 | #189 | Fair 79.4% |
| Immigrants | Syria | 30.8 /100 | #190 | Fair 79.4% |
| Swiss | 28.9 /100 | #191 | Fair 79.4% |
| Immigrants | Denmark | 26.9 /100 | #192 | Fair 79.4% |
| Indonesians | 26.1 /100 | #193 | Fair 79.4% |
| Immigrants | Thailand | 24.8 /100 | #194 | Fair 79.4% |
| Immigrants | Austria | 23.7 /100 | #195 | Fair 79.4% |
| Ecuadorians | 23.1 /100 | #196 | Fair 79.4% |
| Immigrants | Senegal | 22.5 /100 | #197 | Fair 79.4% |
| Immigrants | Laos | 21.5 /100 | #198 | Fair 79.4% |