Immigrants from Kazakhstan vs Costa Rican In Labor Force | Age 20-24
COMPARE
Immigrants from Kazakhstan
Costa Rican
In Labor Force | Age 20-24
In Labor Force | Age 20-24 Comparison
Immigrants from Kazakhstan
Costa Ricans
73.8%
IN LABOR FORCE | AGE 20-24
1.1/ 100
METRIC RATING
252nd/ 347
METRIC RANK
75.2%
IN LABOR FORCE | AGE 20-24
64.2/ 100
METRIC RATING
163rd/ 347
METRIC RANK
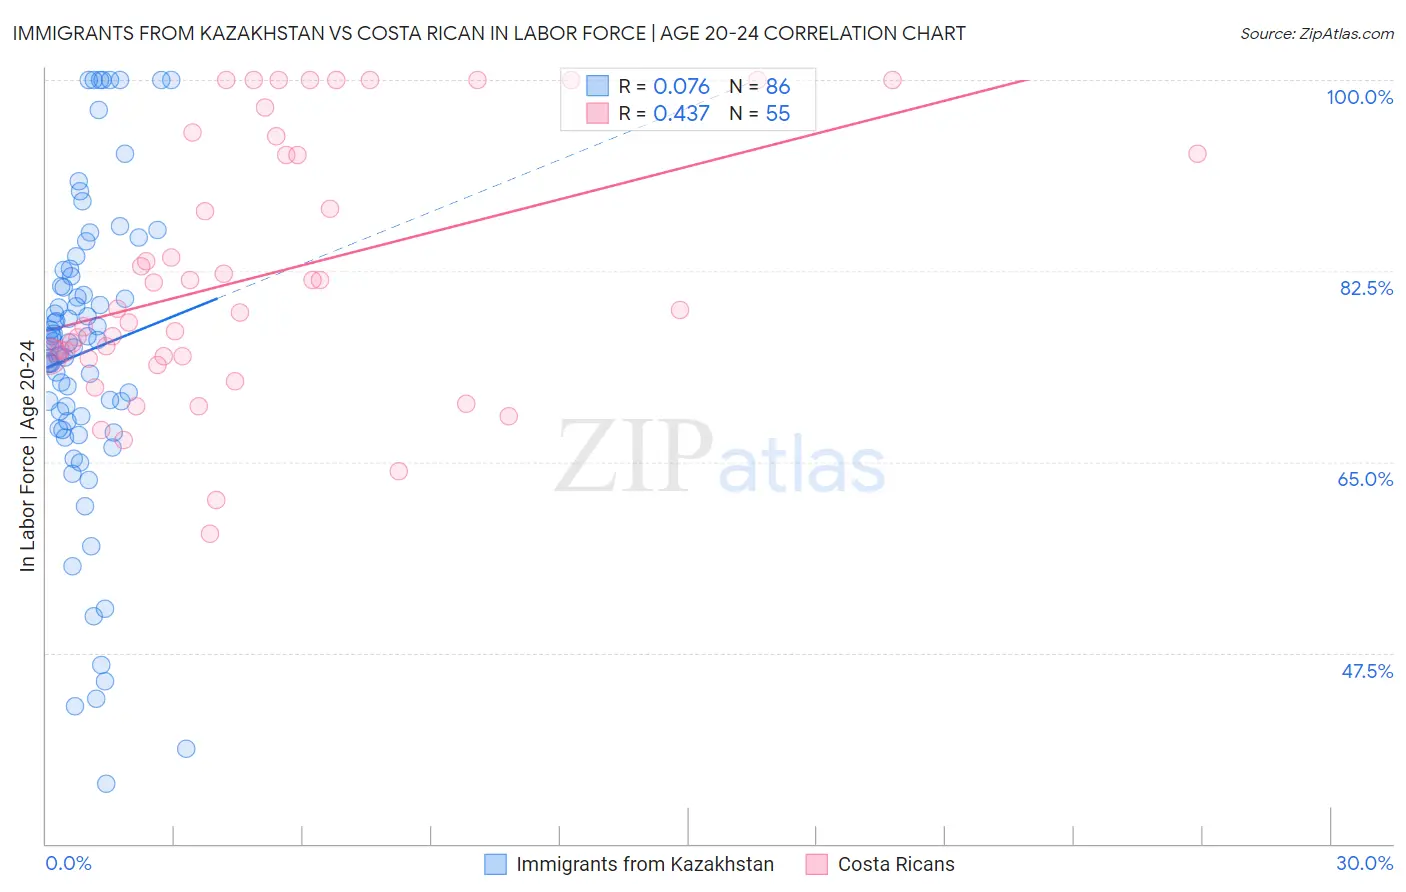
Immigrants from Kazakhstan vs Costa Rican In Labor Force | Age 20-24 Correlation Chart
The statistical analysis conducted on geographies consisting of 124,438,220 people shows a slight positive correlation between the proportion of Immigrants from Kazakhstan and labor force participation rate among population between the ages 20 and 24 in the United States with a correlation coefficient (R) of 0.076 and weighted average of 73.8%. Similarly, the statistical analysis conducted on geographies consisting of 253,576,845 people shows a moderate positive correlation between the proportion of Costa Ricans and labor force participation rate among population between the ages 20 and 24 in the United States with a correlation coefficient (R) of 0.437 and weighted average of 75.2%, a difference of 1.9%.
In Labor Force | Age 20-24 Correlation Summary
| Measurement | Immigrants from Kazakhstan | Costa Rican |
| Minimum | 35.5% | 58.4% |
| Maximum | 100.0% | 100.0% |
| Range | 64.5% | 41.6% |
| Mean | 75.0% | 82.1% |
| Median | 76.0% | 78.9% |
| Interquartile 25% (IQ1) | 68.8% | 74.6% |
| Interquartile 75% (IQ3) | 82.0% | 93.2% |
| Interquartile Range (IQR) | 13.2% | 18.6% |
| Standard Deviation (Sample) | 14.3% | 11.7% |
| Standard Deviation (Population) | 14.2% | 11.6% |
Similar Demographics by In Labor Force | Age 20-24
Demographics Similar to Immigrants from Kazakhstan by In Labor Force | Age 20-24
In terms of in labor force | age 20-24, the demographic groups most similar to Immigrants from Kazakhstan are Immigrants from Egypt (73.8%, a difference of 0.020%), Black/African American (73.9%, a difference of 0.040%), Immigrants from Belgium (73.9%, a difference of 0.040%), Arapaho (73.8%, a difference of 0.040%), and Ute (73.8%, a difference of 0.050%).
| Demographics | Rating | Rank | In Labor Force | Age 20-24 |
| Turks | 1.8 /100 | #245 | Tragic 73.9% |
| Immigrants | Panama | 1.6 /100 | #246 | Tragic 73.9% |
| Colville | 1.5 /100 | #247 | Tragic 73.9% |
| Immigrants | Saudi Arabia | 1.5 /100 | #248 | Tragic 73.9% |
| Blacks/African Americans | 1.3 /100 | #249 | Tragic 73.9% |
| Immigrants | Belgium | 1.3 /100 | #250 | Tragic 73.9% |
| Immigrants | Egypt | 1.2 /100 | #251 | Tragic 73.8% |
| Immigrants | Kazakhstan | 1.1 /100 | #252 | Tragic 73.8% |
| Arapaho | 1.0 /100 | #253 | Tragic 73.8% |
| Ute | 1.0 /100 | #254 | Tragic 73.8% |
| Immigrants | Pakistan | 0.9 /100 | #255 | Tragic 73.8% |
| Spanish American Indians | 0.8 /100 | #256 | Tragic 73.7% |
| Paraguayans | 0.8 /100 | #257 | Tragic 73.7% |
| Egyptians | 0.7 /100 | #258 | Tragic 73.7% |
| Dutch West Indians | 0.7 /100 | #259 | Tragic 73.7% |
Demographics Similar to Costa Ricans by In Labor Force | Age 20-24
In terms of in labor force | age 20-24, the demographic groups most similar to Costa Ricans are Bolivian (75.2%, a difference of 0.0%), Immigrants from Romania (75.2%, a difference of 0.010%), Afghan (75.2%, a difference of 0.010%), New Zealander (75.2%, a difference of 0.020%), and Cambodian (75.2%, a difference of 0.060%).
| Demographics | Rating | Rank | In Labor Force | Age 20-24 |
| Immigrants | El Salvador | 71.7 /100 | #156 | Good 75.3% |
| Immigrants | Western Europe | 71.5 /100 | #157 | Good 75.3% |
| Immigrants | Bolivia | 71.0 /100 | #158 | Good 75.3% |
| South American Indians | 69.0 /100 | #159 | Good 75.3% |
| Japanese | 68.7 /100 | #160 | Good 75.3% |
| New Zealanders | 65.4 /100 | #161 | Good 75.2% |
| Immigrants | Romania | 64.6 /100 | #162 | Good 75.2% |
| Costa Ricans | 64.2 /100 | #163 | Good 75.2% |
| Bolivians | 64.0 /100 | #164 | Good 75.2% |
| Afghans | 63.5 /100 | #165 | Good 75.2% |
| Cambodians | 60.5 /100 | #166 | Good 75.2% |
| Immigrants | South Eastern Asia | 57.5 /100 | #167 | Average 75.1% |
| Immigrants | Western Africa | 56.7 /100 | #168 | Average 75.1% |
| Immigrants | Philippines | 55.8 /100 | #169 | Average 75.1% |
| Mexicans | 52.1 /100 | #170 | Average 75.1% |