Marshallese vs Japanese In Labor Force | Age 20-24
COMPARE
Marshallese
Japanese
In Labor Force | Age 20-24
In Labor Force | Age 20-24 Comparison
Marshallese
Japanese
77.4%
IN LABOR FORCE | AGE 20-24
100.0/ 100
METRIC RATING
38th/ 347
METRIC RANK
75.3%
IN LABOR FORCE | AGE 20-24
68.7/ 100
METRIC RATING
160th/ 347
METRIC RANK
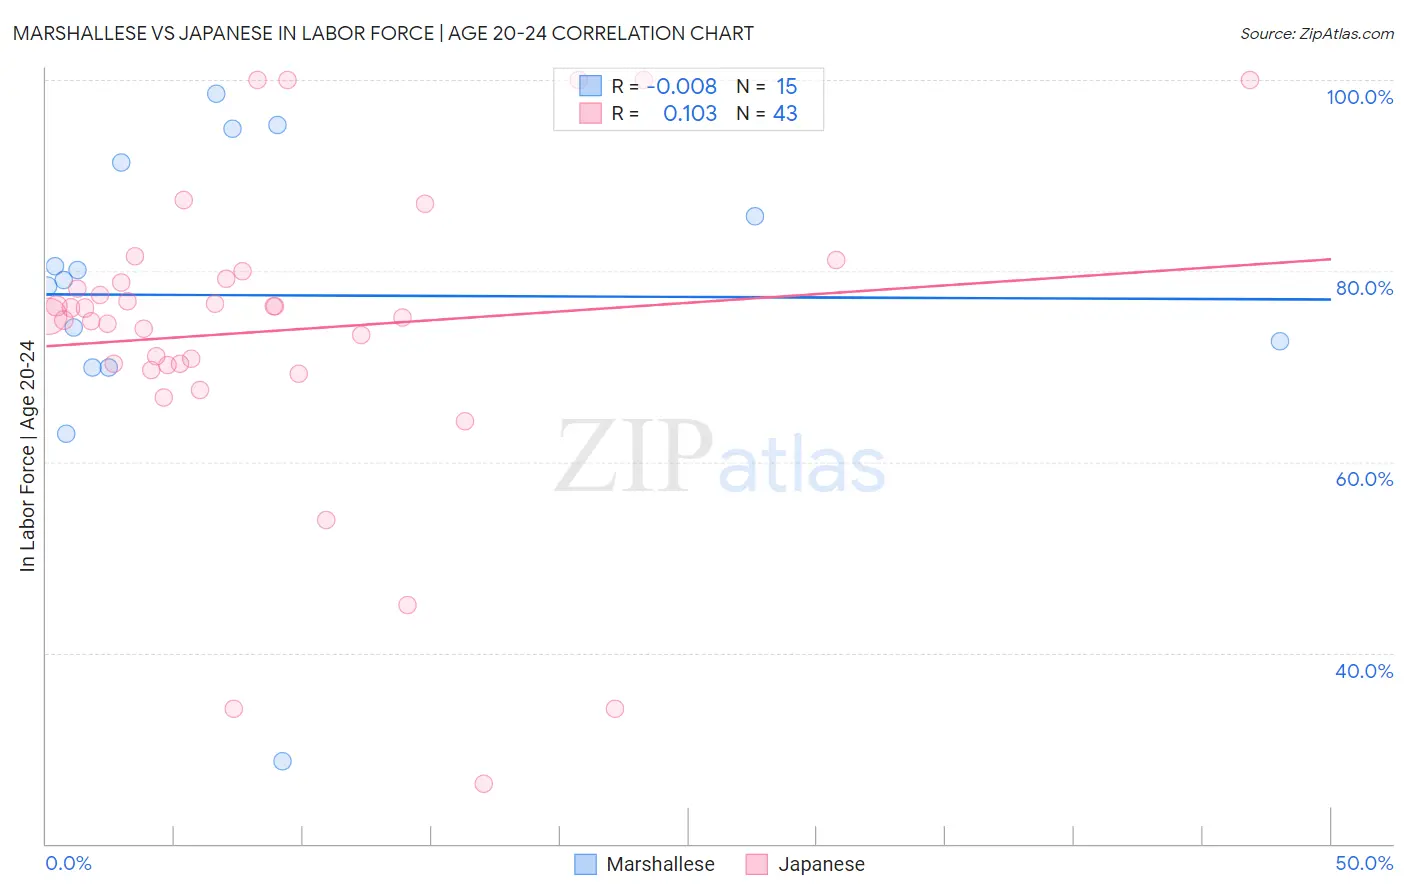
Marshallese vs Japanese In Labor Force | Age 20-24 Correlation Chart
The statistical analysis conducted on geographies consisting of 14,760,991 people shows no correlation between the proportion of Marshallese and labor force participation rate among population between the ages 20 and 24 in the United States with a correlation coefficient (R) of -0.008 and weighted average of 77.4%. Similarly, the statistical analysis conducted on geographies consisting of 249,162,424 people shows a poor positive correlation between the proportion of Japanese and labor force participation rate among population between the ages 20 and 24 in the United States with a correlation coefficient (R) of 0.103 and weighted average of 75.3%, a difference of 2.9%.
In Labor Force | Age 20-24 Correlation Summary
| Measurement | Marshallese | Japanese |
| Minimum | 28.6% | 26.3% |
| Maximum | 98.5% | 100.0% |
| Range | 69.9% | 73.7% |
| Mean | 77.5% | 73.7% |
| Median | 79.1% | 75.3% |
| Interquartile 25% (IQ1) | 69.9% | 70.1% |
| Interquartile 75% (IQ3) | 91.3% | 79.2% |
| Interquartile Range (IQR) | 21.4% | 9.1% |
| Standard Deviation (Sample) | 17.1% | 16.2% |
| Standard Deviation (Population) | 16.5% | 16.0% |
Similar Demographics by In Labor Force | Age 20-24
Demographics Similar to Marshallese by In Labor Force | Age 20-24
In terms of in labor force | age 20-24, the demographic groups most similar to Marshallese are Irish (77.4%, a difference of 0.030%), Czechoslovakian (77.5%, a difference of 0.050%), Scottish (77.4%, a difference of 0.060%), Welsh (77.5%, a difference of 0.070%), and Immigrants from Congo (77.4%, a difference of 0.070%).
| Demographics | Rating | Rank | In Labor Force | Age 20-24 |
| Poles | 100.0 /100 | #31 | Exceptional 77.6% |
| English | 100.0 /100 | #32 | Exceptional 77.6% |
| Immigrants | Ethiopia | 100.0 /100 | #33 | Exceptional 77.5% |
| German Russians | 100.0 /100 | #34 | Exceptional 77.5% |
| Immigrants | Eastern Africa | 100.0 /100 | #35 | Exceptional 77.5% |
| Welsh | 100.0 /100 | #36 | Exceptional 77.5% |
| Czechoslovakians | 100.0 /100 | #37 | Exceptional 77.5% |
| Marshallese | 100.0 /100 | #38 | Exceptional 77.4% |
| Irish | 100.0 /100 | #39 | Exceptional 77.4% |
| Scottish | 100.0 /100 | #40 | Exceptional 77.4% |
| Immigrants | Congo | 100.0 /100 | #41 | Exceptional 77.4% |
| French | 100.0 /100 | #42 | Exceptional 77.4% |
| Immigrants | Laos | 100.0 /100 | #43 | Exceptional 77.4% |
| Fijians | 100.0 /100 | #44 | Exceptional 77.4% |
| Native Hawaiians | 100.0 /100 | #45 | Exceptional 77.4% |
Demographics Similar to Japanese by In Labor Force | Age 20-24
In terms of in labor force | age 20-24, the demographic groups most similar to Japanese are South American Indian (75.3%, a difference of 0.010%), Immigrants from Bolivia (75.3%, a difference of 0.040%), Immigrants from El Salvador (75.3%, a difference of 0.050%), Immigrants from Western Europe (75.3%, a difference of 0.050%), and New Zealander (75.2%, a difference of 0.050%).
| Demographics | Rating | Rank | In Labor Force | Age 20-24 |
| Guatemalans | 72.3 /100 | #153 | Good 75.3% |
| Osage | 72.3 /100 | #154 | Good 75.3% |
| Immigrants | Guatemala | 71.9 /100 | #155 | Good 75.3% |
| Immigrants | El Salvador | 71.7 /100 | #156 | Good 75.3% |
| Immigrants | Western Europe | 71.5 /100 | #157 | Good 75.3% |
| Immigrants | Bolivia | 71.0 /100 | #158 | Good 75.3% |
| South American Indians | 69.0 /100 | #159 | Good 75.3% |
| Japanese | 68.7 /100 | #160 | Good 75.3% |
| New Zealanders | 65.4 /100 | #161 | Good 75.2% |
| Immigrants | Romania | 64.6 /100 | #162 | Good 75.2% |
| Costa Ricans | 64.2 /100 | #163 | Good 75.2% |
| Bolivians | 64.0 /100 | #164 | Good 75.2% |
| Afghans | 63.5 /100 | #165 | Good 75.2% |
| Cambodians | 60.5 /100 | #166 | Good 75.2% |
| Immigrants | South Eastern Asia | 57.5 /100 | #167 | Average 75.1% |