Marshallese vs Slovene In Labor Force | Age 20-24
COMPARE
Marshallese
Slovene
In Labor Force | Age 20-24
In Labor Force | Age 20-24 Comparison
Marshallese
Slovenes
77.4%
IN LABOR FORCE | AGE 20-24
100.0/ 100
METRIC RATING
38th/ 347
METRIC RANK
78.7%
IN LABOR FORCE | AGE 20-24
100.0/ 100
METRIC RATING
10th/ 347
METRIC RANK
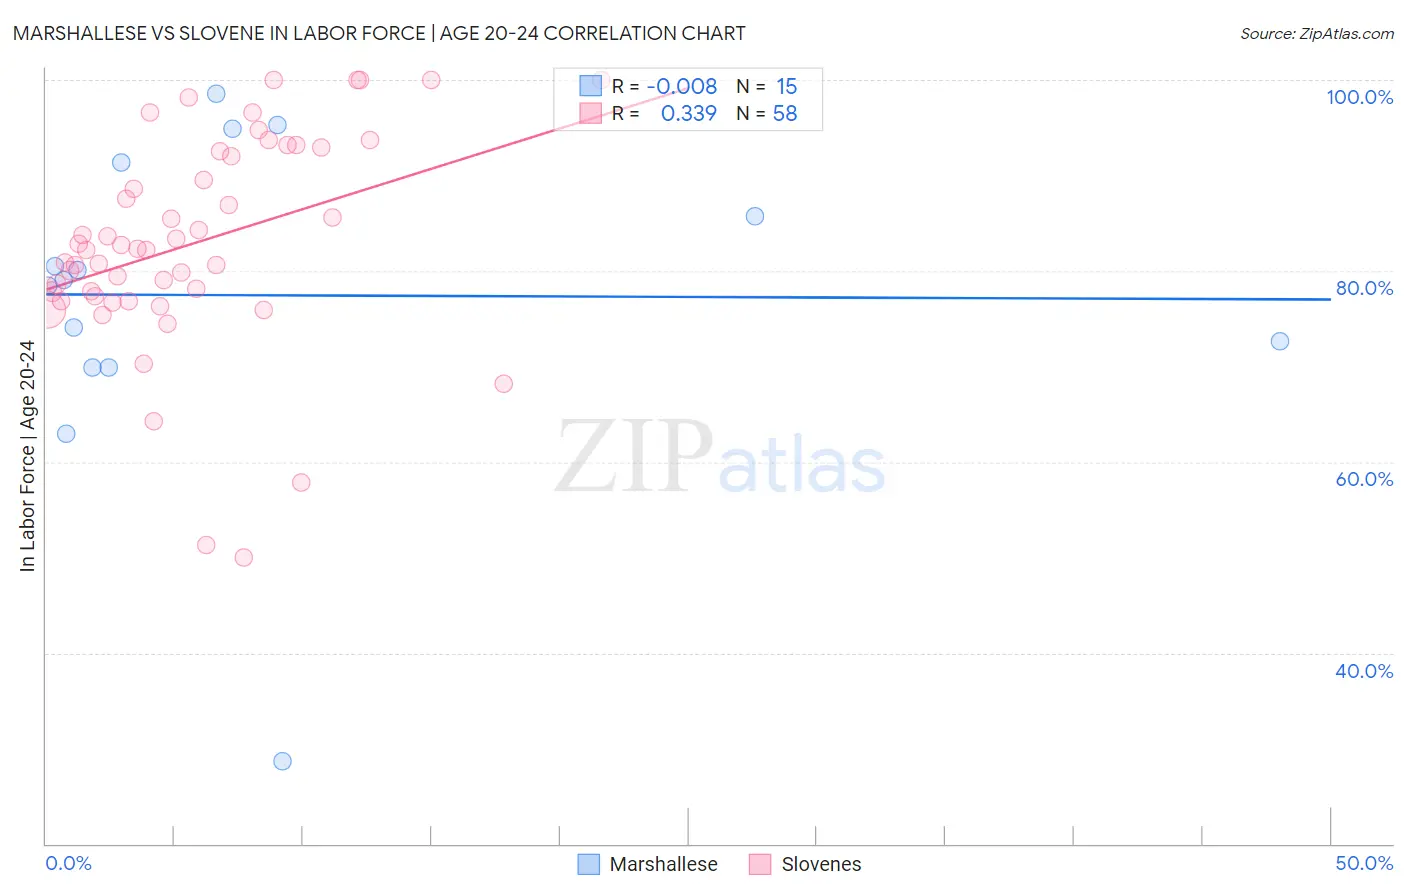
Marshallese vs Slovene In Labor Force | Age 20-24 Correlation Chart
The statistical analysis conducted on geographies consisting of 14,760,991 people shows no correlation between the proportion of Marshallese and labor force participation rate among population between the ages 20 and 24 in the United States with a correlation coefficient (R) of -0.008 and weighted average of 77.4%. Similarly, the statistical analysis conducted on geographies consisting of 261,217,826 people shows a mild positive correlation between the proportion of Slovenes and labor force participation rate among population between the ages 20 and 24 in the United States with a correlation coefficient (R) of 0.339 and weighted average of 78.7%, a difference of 1.6%.
In Labor Force | Age 20-24 Correlation Summary
| Measurement | Marshallese | Slovene |
| Minimum | 28.6% | 50.0% |
| Maximum | 98.5% | 100.0% |
| Range | 69.9% | 50.0% |
| Mean | 77.5% | 82.9% |
| Median | 79.1% | 82.3% |
| Interquartile 25% (IQ1) | 69.9% | 77.3% |
| Interquartile 75% (IQ3) | 91.3% | 92.5% |
| Interquartile Range (IQR) | 21.4% | 15.1% |
| Standard Deviation (Sample) | 17.1% | 11.1% |
| Standard Deviation (Population) | 16.5% | 11.0% |
Similar Demographics by In Labor Force | Age 20-24
Demographics Similar to Marshallese by In Labor Force | Age 20-24
In terms of in labor force | age 20-24, the demographic groups most similar to Marshallese are Irish (77.4%, a difference of 0.030%), Czechoslovakian (77.5%, a difference of 0.050%), Scottish (77.4%, a difference of 0.060%), Welsh (77.5%, a difference of 0.070%), and Immigrants from Congo (77.4%, a difference of 0.070%).
| Demographics | Rating | Rank | In Labor Force | Age 20-24 |
| Poles | 100.0 /100 | #31 | Exceptional 77.6% |
| English | 100.0 /100 | #32 | Exceptional 77.6% |
| Immigrants | Ethiopia | 100.0 /100 | #33 | Exceptional 77.5% |
| German Russians | 100.0 /100 | #34 | Exceptional 77.5% |
| Immigrants | Eastern Africa | 100.0 /100 | #35 | Exceptional 77.5% |
| Welsh | 100.0 /100 | #36 | Exceptional 77.5% |
| Czechoslovakians | 100.0 /100 | #37 | Exceptional 77.5% |
| Marshallese | 100.0 /100 | #38 | Exceptional 77.4% |
| Irish | 100.0 /100 | #39 | Exceptional 77.4% |
| Scottish | 100.0 /100 | #40 | Exceptional 77.4% |
| Immigrants | Congo | 100.0 /100 | #41 | Exceptional 77.4% |
| French | 100.0 /100 | #42 | Exceptional 77.4% |
| Immigrants | Laos | 100.0 /100 | #43 | Exceptional 77.4% |
| Fijians | 100.0 /100 | #44 | Exceptional 77.4% |
| Native Hawaiians | 100.0 /100 | #45 | Exceptional 77.4% |
Demographics Similar to Slovenes by In Labor Force | Age 20-24
In terms of in labor force | age 20-24, the demographic groups most similar to Slovenes are Finnish (78.7%, a difference of 0.040%), German (78.6%, a difference of 0.15%), Swedish (78.8%, a difference of 0.16%), Scandinavian (78.5%, a difference of 0.21%), and Immigrants from Cabo Verde (78.9%, a difference of 0.22%).
| Demographics | Rating | Rank | In Labor Force | Age 20-24 |
| Somalis | 100.0 /100 | #3 | Exceptional 79.3% |
| Alaskan Athabascans | 100.0 /100 | #4 | Exceptional 79.1% |
| Aleuts | 100.0 /100 | #5 | Exceptional 79.0% |
| Danes | 100.0 /100 | #6 | Exceptional 79.0% |
| Luxembourgers | 100.0 /100 | #7 | Exceptional 79.0% |
| Immigrants | Cabo Verde | 100.0 /100 | #8 | Exceptional 78.9% |
| Swedes | 100.0 /100 | #9 | Exceptional 78.8% |
| Slovenes | 100.0 /100 | #10 | Exceptional 78.7% |
| Finns | 100.0 /100 | #11 | Exceptional 78.7% |
| Germans | 100.0 /100 | #12 | Exceptional 78.6% |
| Scandinavians | 100.0 /100 | #13 | Exceptional 78.5% |
| Czechs | 100.0 /100 | #14 | Exceptional 78.5% |
| Sudanese | 100.0 /100 | #15 | Exceptional 78.4% |
| Dutch | 100.0 /100 | #16 | Exceptional 78.4% |
| Cape Verdeans | 100.0 /100 | #17 | Exceptional 78.3% |