African vs Japanese In Labor Force | Age 20-24
COMPARE
African
Japanese
In Labor Force | Age 20-24
In Labor Force | Age 20-24 Comparison
Africans
Japanese
75.0%
IN LABOR FORCE | AGE 20-24
42.5/ 100
METRIC RATING
181st/ 347
METRIC RANK
75.3%
IN LABOR FORCE | AGE 20-24
68.7/ 100
METRIC RATING
160th/ 347
METRIC RANK
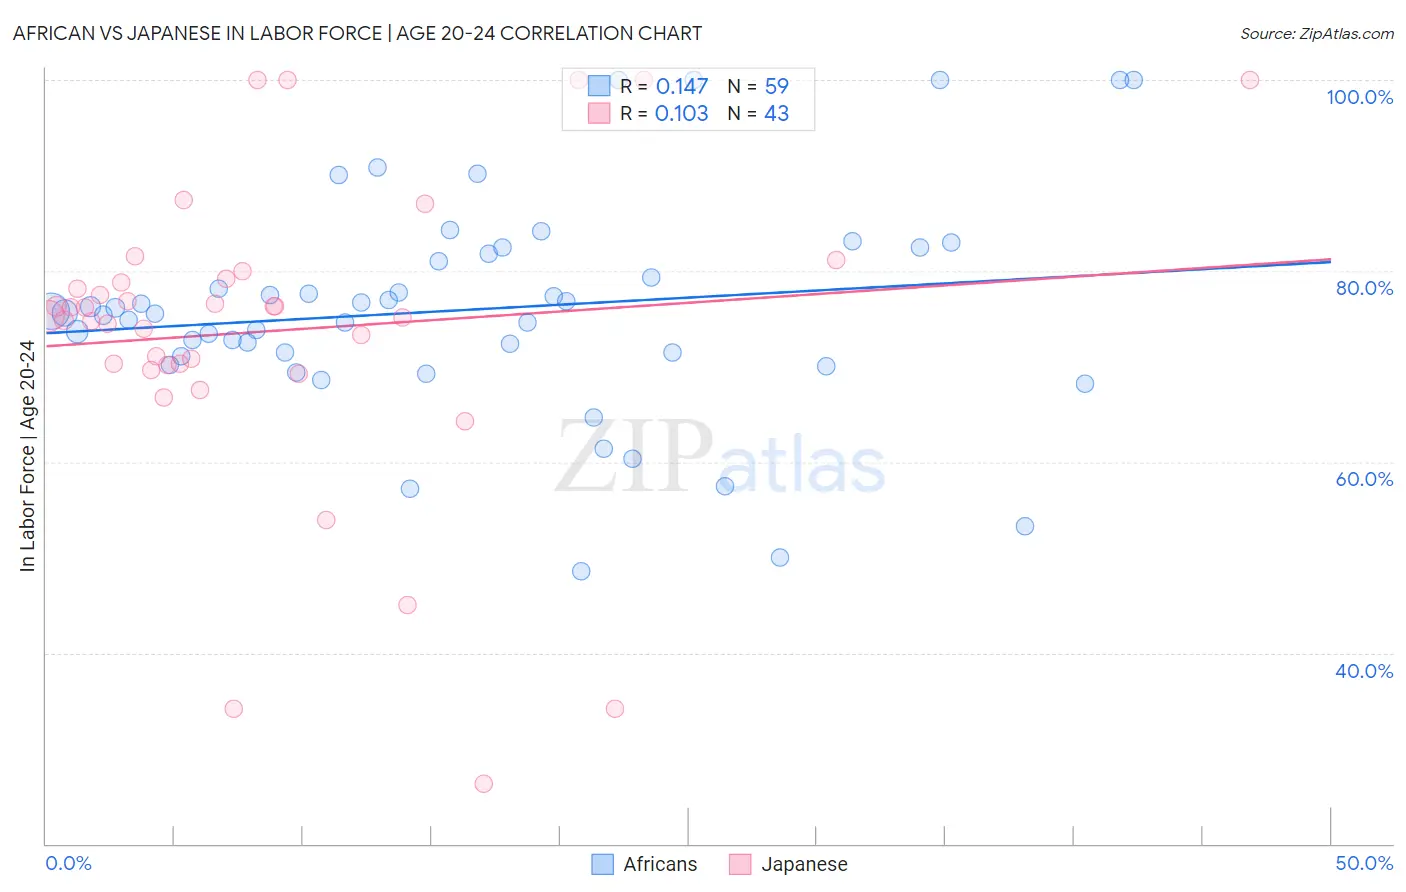
African vs Japanese In Labor Force | Age 20-24 Correlation Chart
The statistical analysis conducted on geographies consisting of 469,871,149 people shows a poor positive correlation between the proportion of Africans and labor force participation rate among population between the ages 20 and 24 in the United States with a correlation coefficient (R) of 0.147 and weighted average of 75.0%. Similarly, the statistical analysis conducted on geographies consisting of 249,162,424 people shows a poor positive correlation between the proportion of Japanese and labor force participation rate among population between the ages 20 and 24 in the United States with a correlation coefficient (R) of 0.103 and weighted average of 75.3%, a difference of 0.40%.
In Labor Force | Age 20-24 Correlation Summary
| Measurement | African | Japanese |
| Minimum | 48.6% | 26.3% |
| Maximum | 100.0% | 100.0% |
| Range | 51.4% | 73.7% |
| Mean | 75.9% | 73.7% |
| Median | 75.6% | 75.3% |
| Interquartile 25% (IQ1) | 71.0% | 70.1% |
| Interquartile 75% (IQ3) | 81.7% | 79.2% |
| Interquartile Range (IQR) | 10.7% | 9.1% |
| Standard Deviation (Sample) | 11.4% | 16.2% |
| Standard Deviation (Population) | 11.3% | 16.0% |
Similar Demographics by In Labor Force | Age 20-24
Demographics Similar to Africans by In Labor Force | Age 20-24
In terms of in labor force | age 20-24, the demographic groups most similar to Africans are Immigrants from Latvia (75.0%, a difference of 0.020%), Immigrants from Czechoslovakia (75.0%, a difference of 0.020%), Immigrants from Central America (75.0%, a difference of 0.040%), Immigrants from Mexico (75.0%, a difference of 0.080%), and Immigrants from South Africa (74.9%, a difference of 0.080%).
| Demographics | Rating | Rank | In Labor Force | Age 20-24 |
| South Africans | 50.0 /100 | #174 | Average 75.0% |
| Syrians | 49.5 /100 | #175 | Average 75.0% |
| Central Americans | 48.7 /100 | #176 | Average 75.0% |
| Immigrants | Mexico | 47.8 /100 | #177 | Average 75.0% |
| Immigrants | Central America | 45.0 /100 | #178 | Average 75.0% |
| Immigrants | Latvia | 44.1 /100 | #179 | Average 75.0% |
| Immigrants | Czechoslovakia | 44.0 /100 | #180 | Average 75.0% |
| Africans | 42.5 /100 | #181 | Average 75.0% |
| Immigrants | South Africa | 36.9 /100 | #182 | Fair 74.9% |
| Immigrants | Costa Rica | 36.7 /100 | #183 | Fair 74.9% |
| Immigrants | Hungary | 35.0 /100 | #184 | Fair 74.9% |
| Sri Lankans | 34.9 /100 | #185 | Fair 74.9% |
| Immigrants | Eastern Europe | 33.8 /100 | #186 | Fair 74.9% |
| Immigrants | Honduras | 33.5 /100 | #187 | Fair 74.9% |
| Hondurans | 32.7 /100 | #188 | Fair 74.8% |
Demographics Similar to Japanese by In Labor Force | Age 20-24
In terms of in labor force | age 20-24, the demographic groups most similar to Japanese are South American Indian (75.3%, a difference of 0.010%), Immigrants from Bolivia (75.3%, a difference of 0.040%), Immigrants from El Salvador (75.3%, a difference of 0.050%), Immigrants from Western Europe (75.3%, a difference of 0.050%), and New Zealander (75.2%, a difference of 0.050%).
| Demographics | Rating | Rank | In Labor Force | Age 20-24 |
| Guatemalans | 72.3 /100 | #153 | Good 75.3% |
| Osage | 72.3 /100 | #154 | Good 75.3% |
| Immigrants | Guatemala | 71.9 /100 | #155 | Good 75.3% |
| Immigrants | El Salvador | 71.7 /100 | #156 | Good 75.3% |
| Immigrants | Western Europe | 71.5 /100 | #157 | Good 75.3% |
| Immigrants | Bolivia | 71.0 /100 | #158 | Good 75.3% |
| South American Indians | 69.0 /100 | #159 | Good 75.3% |
| Japanese | 68.7 /100 | #160 | Good 75.3% |
| New Zealanders | 65.4 /100 | #161 | Good 75.2% |
| Immigrants | Romania | 64.6 /100 | #162 | Good 75.2% |
| Costa Ricans | 64.2 /100 | #163 | Good 75.2% |
| Bolivians | 64.0 /100 | #164 | Good 75.2% |
| Afghans | 63.5 /100 | #165 | Good 75.2% |
| Cambodians | 60.5 /100 | #166 | Good 75.2% |
| Immigrants | South Eastern Asia | 57.5 /100 | #167 | Average 75.1% |