Maltese vs Immigrants from Venezuela In Labor Force | Age 20-64
COMPARE
Maltese
Immigrants from Venezuela
In Labor Force | Age 20-64
In Labor Force | Age 20-64 Comparison
Maltese
Immigrants from Venezuela
80.0%
IN LABOR FORCE | AGE 20-64
92.4/ 100
METRIC RATING
120th/ 347
METRIC RANK
80.1%
IN LABOR FORCE | AGE 20-64
96.8/ 100
METRIC RATING
89th/ 347
METRIC RANK
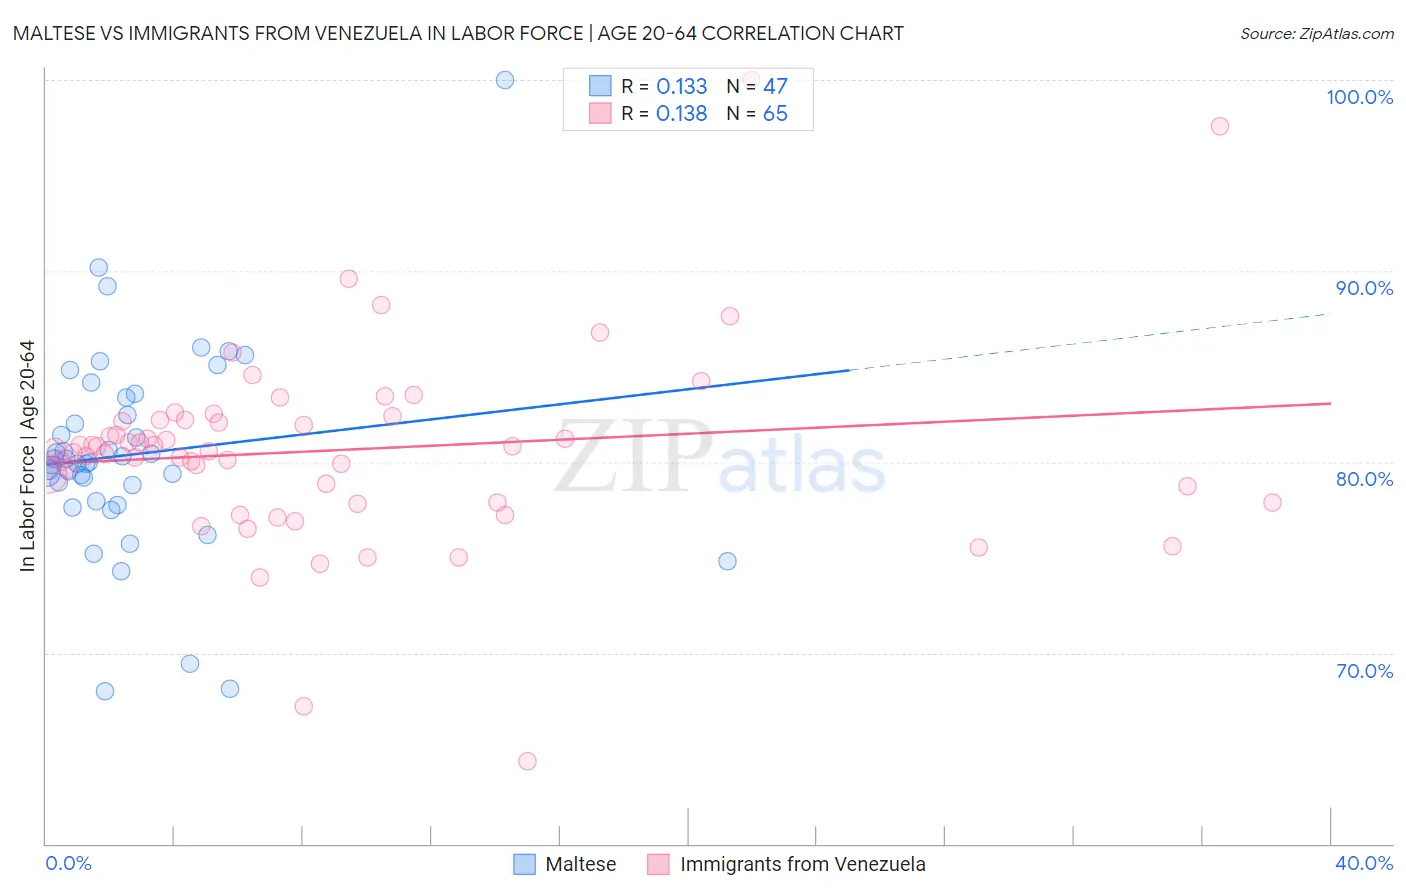
Maltese vs Immigrants from Venezuela In Labor Force | Age 20-64 Correlation Chart
The statistical analysis conducted on geographies consisting of 126,477,906 people shows a poor positive correlation between the proportion of Maltese and labor force participation rate among population between the ages 20 and 64 in the United States with a correlation coefficient (R) of 0.133 and weighted average of 80.0%. Similarly, the statistical analysis conducted on geographies consisting of 287,871,392 people shows a poor positive correlation between the proportion of Immigrants from Venezuela and labor force participation rate among population between the ages 20 and 64 in the United States with a correlation coefficient (R) of 0.138 and weighted average of 80.1%, a difference of 0.18%.
In Labor Force | Age 20-64 Correlation Summary
| Measurement | Maltese | Immigrants from Venezuela |
| Minimum | 68.0% | 64.3% |
| Maximum | 100.0% | 100.0% |
| Range | 32.0% | 35.7% |
| Mean | 80.4% | 80.6% |
| Median | 79.9% | 80.7% |
| Interquartile 25% (IQ1) | 77.9% | 77.9% |
| Interquartile 75% (IQ3) | 83.4% | 82.2% |
| Interquartile Range (IQR) | 5.5% | 4.3% |
| Standard Deviation (Sample) | 5.4% | 5.2% |
| Standard Deviation (Population) | 5.4% | 5.2% |
Similar Demographics by In Labor Force | Age 20-64
Demographics Similar to Maltese by In Labor Force | Age 20-64
In terms of in labor force | age 20-64, the demographic groups most similar to Maltese are Immigrants from Taiwan (80.0%, a difference of 0.0%), Immigrants from Vietnam (80.0%, a difference of 0.010%), Cape Verdean (80.0%, a difference of 0.010%), Immigrants from Kuwait (80.0%, a difference of 0.010%), and Mongolian (79.9%, a difference of 0.010%).
| Demographics | Rating | Rank | In Labor Force | Age 20-64 |
| Sri Lankans | 93.9 /100 | #113 | Exceptional 80.0% |
| Argentineans | 93.8 /100 | #114 | Exceptional 80.0% |
| Bermudans | 93.3 /100 | #115 | Exceptional 80.0% |
| Immigrants | Western Africa | 93.1 /100 | #116 | Exceptional 80.0% |
| Immigrants | Vietnam | 92.7 /100 | #117 | Exceptional 80.0% |
| Cape Verdeans | 92.7 /100 | #118 | Exceptional 80.0% |
| Immigrants | Taiwan | 92.5 /100 | #119 | Exceptional 80.0% |
| Maltese | 92.4 /100 | #120 | Exceptional 80.0% |
| Immigrants | Kuwait | 92.2 /100 | #121 | Exceptional 80.0% |
| Mongolians | 92.0 /100 | #122 | Exceptional 79.9% |
| Immigrants | Russia | 91.8 /100 | #123 | Exceptional 79.9% |
| Immigrants | Europe | 91.6 /100 | #124 | Exceptional 79.9% |
| Danes | 91.5 /100 | #125 | Exceptional 79.9% |
| Immigrants | France | 90.7 /100 | #126 | Exceptional 79.9% |
| Immigrants | Czechoslovakia | 89.7 /100 | #127 | Excellent 79.9% |
Demographics Similar to Immigrants from Venezuela by In Labor Force | Age 20-64
In terms of in labor force | age 20-64, the demographic groups most similar to Immigrants from Venezuela are Polish (80.1%, a difference of 0.0%), Chilean (80.1%, a difference of 0.010%), Uruguayan (80.1%, a difference of 0.010%), Ghanaian (80.1%, a difference of 0.010%), and Jordanian (80.1%, a difference of 0.020%).
| Demographics | Rating | Rank | In Labor Force | Age 20-64 |
| Immigrants | Japan | 97.3 /100 | #82 | Exceptional 80.1% |
| Colombians | 97.3 /100 | #83 | Exceptional 80.1% |
| Immigrants | Latvia | 97.2 /100 | #84 | Exceptional 80.1% |
| Jordanians | 97.2 /100 | #85 | Exceptional 80.1% |
| Immigrants | Egypt | 97.1 /100 | #86 | Exceptional 80.1% |
| Croatians | 97.1 /100 | #87 | Exceptional 80.1% |
| Chileans | 97.0 /100 | #88 | Exceptional 80.1% |
| Immigrants | Venezuela | 96.8 /100 | #89 | Exceptional 80.1% |
| Poles | 96.8 /100 | #90 | Exceptional 80.1% |
| Uruguayans | 96.7 /100 | #91 | Exceptional 80.1% |
| Ghanaians | 96.7 /100 | #92 | Exceptional 80.1% |
| Immigrants | Belarus | 96.4 /100 | #93 | Exceptional 80.1% |
| Immigrants | Asia | 96.0 /100 | #94 | Exceptional 80.1% |
| Yugoslavians | 95.9 /100 | #95 | Exceptional 80.1% |
| Immigrants | Malaysia | 95.9 /100 | #96 | Exceptional 80.1% |