Maltese vs Immigrants from El Salvador In Labor Force | Age 30-34
COMPARE
Maltese
Immigrants from El Salvador
In Labor Force | Age 30-34
In Labor Force | Age 30-34 Comparison
Maltese
Immigrants from El Salvador
85.4%
IN LABOR FORCE | AGE 30-34
99.0/ 100
METRIC RATING
74th/ 347
METRIC RANK
84.2%
IN LABOR FORCE | AGE 30-34
3.0/ 100
METRIC RATING
226th/ 347
METRIC RANK
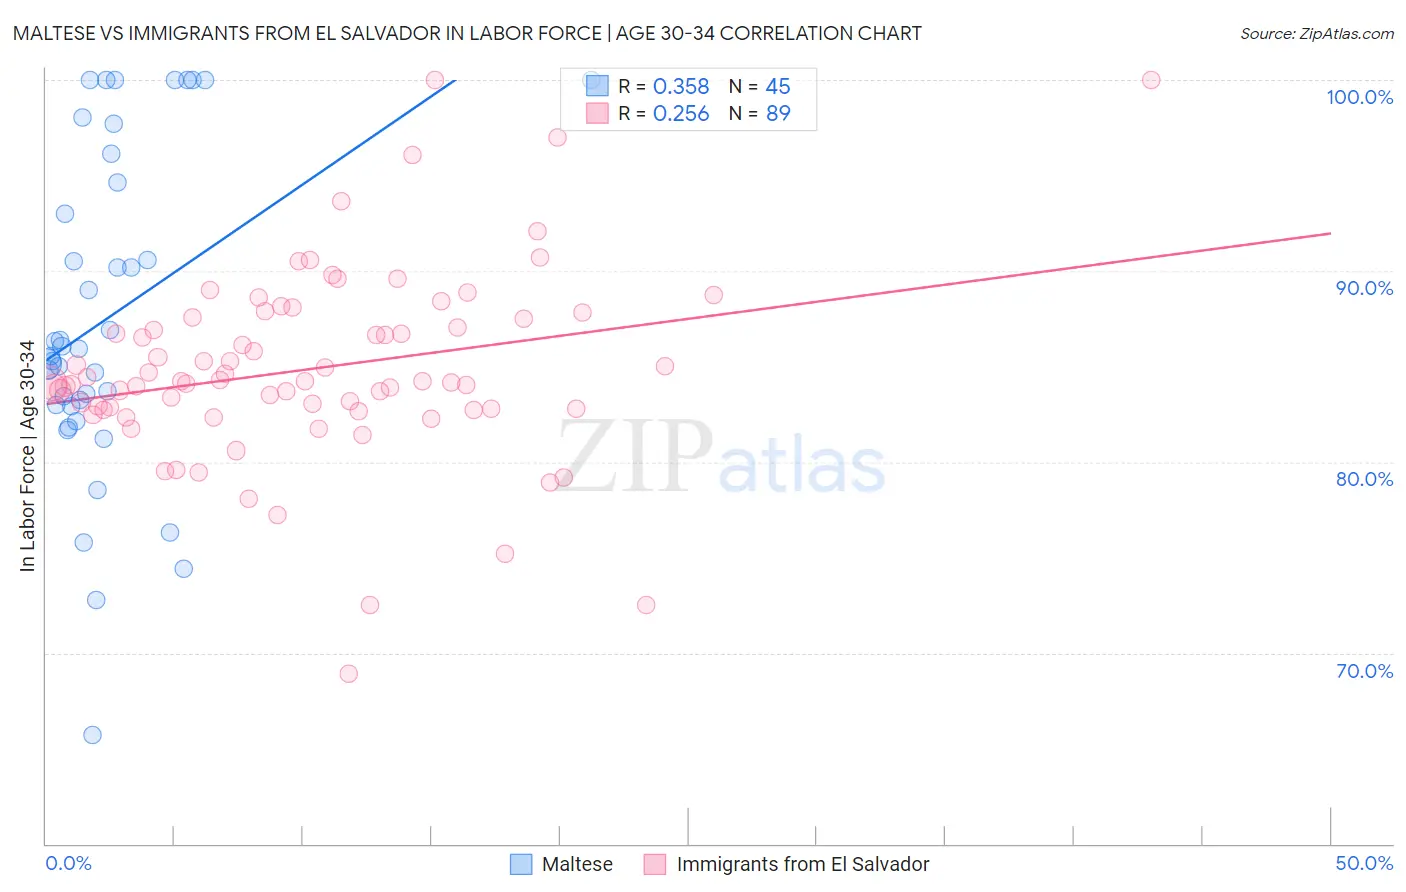
Maltese vs Immigrants from El Salvador In Labor Force | Age 30-34 Correlation Chart
The statistical analysis conducted on geographies consisting of 126,441,405 people shows a mild positive correlation between the proportion of Maltese and labor force participation rate among population between the ages 30 and 34 in the United States with a correlation coefficient (R) of 0.358 and weighted average of 85.4%. Similarly, the statistical analysis conducted on geographies consisting of 357,707,534 people shows a weak positive correlation between the proportion of Immigrants from El Salvador and labor force participation rate among population between the ages 30 and 34 in the United States with a correlation coefficient (R) of 0.256 and weighted average of 84.2%, a difference of 1.4%.
In Labor Force | Age 30-34 Correlation Summary
| Measurement | Maltese | Immigrants from El Salvador |
| Minimum | 65.7% | 68.9% |
| Maximum | 100.0% | 100.0% |
| Range | 34.3% | 31.1% |
| Mean | 87.6% | 84.9% |
| Median | 85.9% | 84.2% |
| Interquartile 25% (IQ1) | 83.0% | 82.8% |
| Interquartile 75% (IQ3) | 95.4% | 87.5% |
| Interquartile Range (IQR) | 12.4% | 4.8% |
| Standard Deviation (Sample) | 8.5% | 5.0% |
| Standard Deviation (Population) | 8.4% | 5.0% |
Similar Demographics by In Labor Force | Age 30-34
Demographics Similar to Maltese by In Labor Force | Age 30-34
In terms of in labor force | age 30-34, the demographic groups most similar to Maltese are Immigrants from China (85.4%, a difference of 0.0%), Indian (Asian) (85.4%, a difference of 0.0%), Brazilian (85.4%, a difference of 0.010%), Immigrants from Japan (85.4%, a difference of 0.010%), and Immigrants from Czechoslovakia (85.4%, a difference of 0.010%).
| Demographics | Rating | Rank | In Labor Force | Age 30-34 |
| Kenyans | 99.3 /100 | #67 | Exceptional 85.4% |
| Immigrants | Eastern Europe | 99.3 /100 | #68 | Exceptional 85.4% |
| Immigrants | Iran | 99.2 /100 | #69 | Exceptional 85.4% |
| Brazilians | 99.1 /100 | #70 | Exceptional 85.4% |
| Immigrants | Japan | 99.1 /100 | #71 | Exceptional 85.4% |
| Immigrants | China | 99.0 /100 | #72 | Exceptional 85.4% |
| Indians (Asian) | 99.0 /100 | #73 | Exceptional 85.4% |
| Maltese | 99.0 /100 | #74 | Exceptional 85.4% |
| Immigrants | Czechoslovakia | 99.0 /100 | #75 | Exceptional 85.4% |
| Iranians | 99.0 /100 | #76 | Exceptional 85.4% |
| Immigrants | Eastern Asia | 98.9 /100 | #77 | Exceptional 85.4% |
| Immigrants | Singapore | 98.8 /100 | #78 | Exceptional 85.3% |
| Immigrants | Switzerland | 98.7 /100 | #79 | Exceptional 85.3% |
| Immigrants | Russia | 98.7 /100 | #80 | Exceptional 85.3% |
| Slovaks | 98.7 /100 | #81 | Exceptional 85.3% |
Demographics Similar to Immigrants from El Salvador by In Labor Force | Age 30-34
In terms of in labor force | age 30-34, the demographic groups most similar to Immigrants from El Salvador are Scottish (84.2%, a difference of 0.0%), Immigrants from Cuba (84.2%, a difference of 0.0%), Immigrants from Haiti (84.2%, a difference of 0.010%), Cuban (84.2%, a difference of 0.020%), and Welsh (84.2%, a difference of 0.020%).
| Demographics | Rating | Rank | In Labor Force | Age 30-34 |
| Swiss | 5.8 /100 | #219 | Tragic 84.3% |
| Danes | 5.3 /100 | #220 | Tragic 84.3% |
| Salvadorans | 3.8 /100 | #221 | Tragic 84.2% |
| Panamanians | 3.8 /100 | #222 | Tragic 84.2% |
| Immigrants | Laos | 3.6 /100 | #223 | Tragic 84.2% |
| Cubans | 3.4 /100 | #224 | Tragic 84.2% |
| Scottish | 3.1 /100 | #225 | Tragic 84.2% |
| Immigrants | El Salvador | 3.0 /100 | #226 | Tragic 84.2% |
| Immigrants | Cuba | 3.0 /100 | #227 | Tragic 84.2% |
| Immigrants | Haiti | 2.8 /100 | #228 | Tragic 84.2% |
| Welsh | 2.7 /100 | #229 | Tragic 84.2% |
| Immigrants | Bahamas | 2.6 /100 | #230 | Tragic 84.1% |
| Malaysians | 2.2 /100 | #231 | Tragic 84.1% |
| Immigrants | Immigrants | 2.0 /100 | #232 | Tragic 84.1% |
| West Indians | 1.9 /100 | #233 | Tragic 84.1% |