Eastern European vs Slovak In Labor Force | Age 30-34
COMPARE
Eastern European
Slovak
In Labor Force | Age 30-34
In Labor Force | Age 30-34 Comparison
Eastern Europeans
Slovaks
85.7%
IN LABOR FORCE | AGE 30-34
99.9/ 100
METRIC RATING
39th/ 347
METRIC RANK
85.3%
IN LABOR FORCE | AGE 30-34
98.7/ 100
METRIC RATING
81st/ 347
METRIC RANK
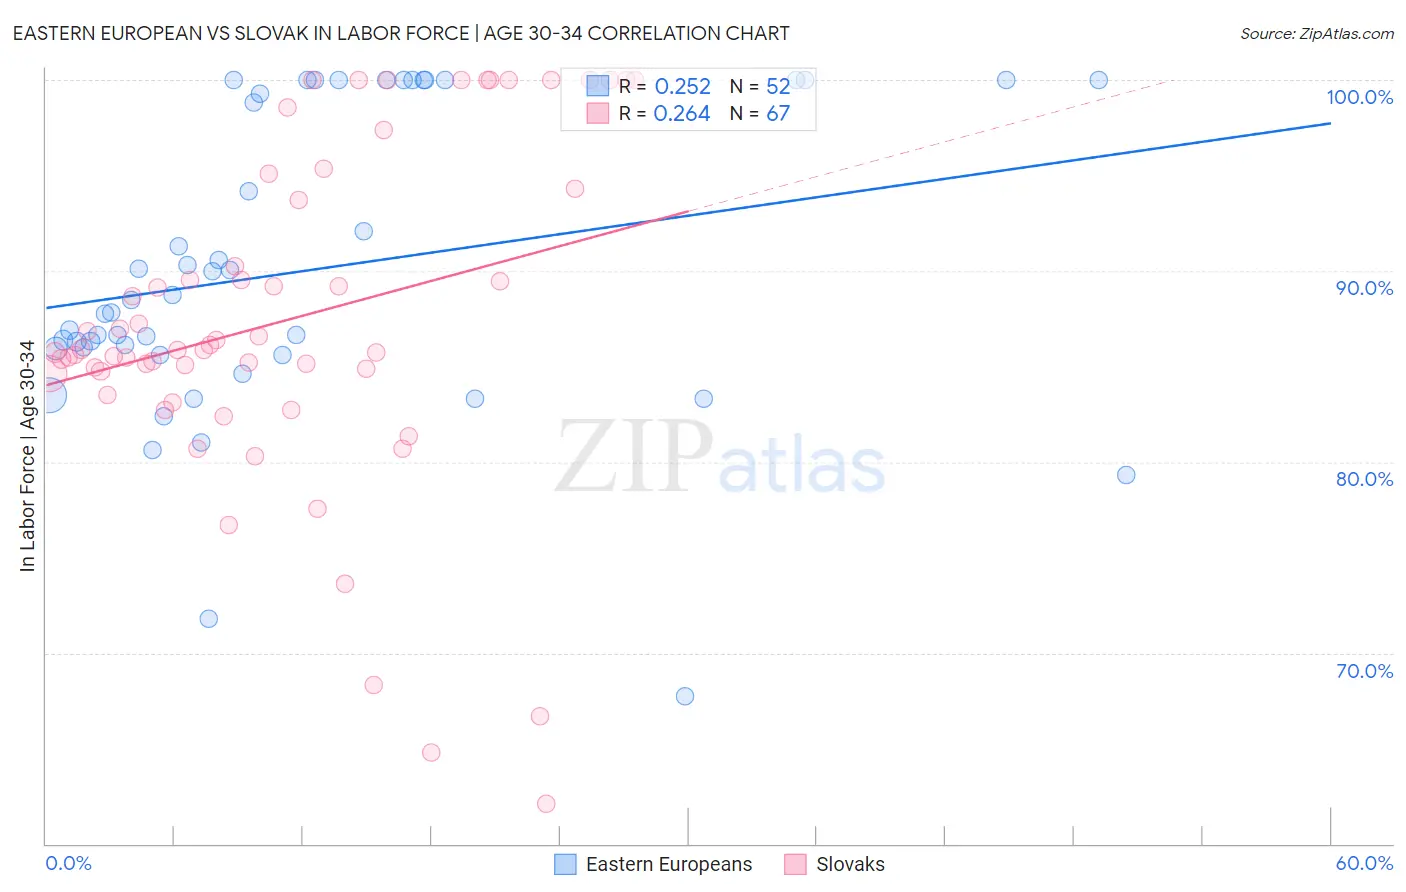
Eastern European vs Slovak In Labor Force | Age 30-34 Correlation Chart
The statistical analysis conducted on geographies consisting of 460,851,415 people shows a weak positive correlation between the proportion of Eastern Europeans and labor force participation rate among population between the ages 30 and 34 in the United States with a correlation coefficient (R) of 0.252 and weighted average of 85.7%. Similarly, the statistical analysis conducted on geographies consisting of 397,592,817 people shows a weak positive correlation between the proportion of Slovaks and labor force participation rate among population between the ages 30 and 34 in the United States with a correlation coefficient (R) of 0.264 and weighted average of 85.3%, a difference of 0.45%.
In Labor Force | Age 30-34 Correlation Summary
| Measurement | Eastern European | Slovak |
| Minimum | 67.7% | 62.1% |
| Maximum | 100.0% | 100.0% |
| Range | 32.3% | 37.9% |
| Mean | 90.0% | 87.4% |
| Median | 88.2% | 85.8% |
| Interquartile 25% (IQ1) | 85.8% | 84.6% |
| Interquartile 75% (IQ3) | 100.0% | 94.3% |
| Interquartile Range (IQR) | 14.2% | 9.7% |
| Standard Deviation (Sample) | 7.9% | 8.8% |
| Standard Deviation (Population) | 7.8% | 8.7% |
Similar Demographics by In Labor Force | Age 30-34
Demographics Similar to Eastern Europeans by In Labor Force | Age 30-34
In terms of in labor force | age 30-34, the demographic groups most similar to Eastern Europeans are Immigrants from Greece (85.7%, a difference of 0.030%), Norwegian (85.7%, a difference of 0.040%), Turkish (85.7%, a difference of 0.040%), Serbian (85.8%, a difference of 0.050%), and Albanian (85.7%, a difference of 0.050%).
| Demographics | Rating | Rank | In Labor Force | Age 30-34 |
| Cypriots | 99.9 /100 | #32 | Exceptional 85.8% |
| Immigrants | Bosnia and Herzegovina | 99.9 /100 | #33 | Exceptional 85.8% |
| Ugandans | 99.9 /100 | #34 | Exceptional 85.8% |
| Serbians | 99.9 /100 | #35 | Exceptional 85.8% |
| Albanians | 99.9 /100 | #36 | Exceptional 85.7% |
| Norwegians | 99.9 /100 | #37 | Exceptional 85.7% |
| Immigrants | Greece | 99.9 /100 | #38 | Exceptional 85.7% |
| Eastern Europeans | 99.9 /100 | #39 | Exceptional 85.7% |
| Turks | 99.9 /100 | #40 | Exceptional 85.7% |
| Immigrants | Italy | 99.9 /100 | #41 | Exceptional 85.7% |
| Zimbabweans | 99.8 /100 | #42 | Exceptional 85.6% |
| Immigrants | Lithuania | 99.8 /100 | #43 | Exceptional 85.6% |
| Immigrants | Sri Lanka | 99.8 /100 | #44 | Exceptional 85.6% |
| Immigrants | Nepal | 99.8 /100 | #45 | Exceptional 85.6% |
| Immigrants | Morocco | 99.8 /100 | #46 | Exceptional 85.6% |
Demographics Similar to Slovaks by In Labor Force | Age 30-34
In terms of in labor force | age 30-34, the demographic groups most similar to Slovaks are Immigrants from Switzerland (85.3%, a difference of 0.010%), Immigrants from Russia (85.3%, a difference of 0.010%), Immigrants from Africa (85.3%, a difference of 0.010%), Immigrants from Europe (85.3%, a difference of 0.010%), and Greek (85.3%, a difference of 0.010%).
| Demographics | Rating | Rank | In Labor Force | Age 30-34 |
| Maltese | 99.0 /100 | #74 | Exceptional 85.4% |
| Immigrants | Czechoslovakia | 99.0 /100 | #75 | Exceptional 85.4% |
| Iranians | 99.0 /100 | #76 | Exceptional 85.4% |
| Immigrants | Eastern Asia | 98.9 /100 | #77 | Exceptional 85.4% |
| Immigrants | Singapore | 98.8 /100 | #78 | Exceptional 85.3% |
| Immigrants | Switzerland | 98.7 /100 | #79 | Exceptional 85.3% |
| Immigrants | Russia | 98.7 /100 | #80 | Exceptional 85.3% |
| Slovaks | 98.7 /100 | #81 | Exceptional 85.3% |
| Immigrants | Africa | 98.6 /100 | #82 | Exceptional 85.3% |
| Immigrants | Europe | 98.6 /100 | #83 | Exceptional 85.3% |
| Greeks | 98.6 /100 | #84 | Exceptional 85.3% |
| Mongolians | 98.5 /100 | #85 | Exceptional 85.3% |
| Immigrants | Taiwan | 98.3 /100 | #86 | Exceptional 85.3% |
| Immigrants | Northern Europe | 98.2 /100 | #87 | Exceptional 85.3% |
| Immigrants | Belgium | 98.2 /100 | #88 | Exceptional 85.3% |