Macedonian vs Immigrants from Guatemala In Labor Force | Age 45-54
COMPARE
Macedonian
Immigrants from Guatemala
In Labor Force | Age 45-54
In Labor Force | Age 45-54 Comparison
Macedonians
Immigrants from Guatemala
83.5%
IN LABOR FORCE | AGE 45-54
98.7/ 100
METRIC RATING
55th/ 347
METRIC RANK
81.1%
IN LABOR FORCE | AGE 45-54
0.0/ 100
METRIC RATING
278th/ 347
METRIC RANK
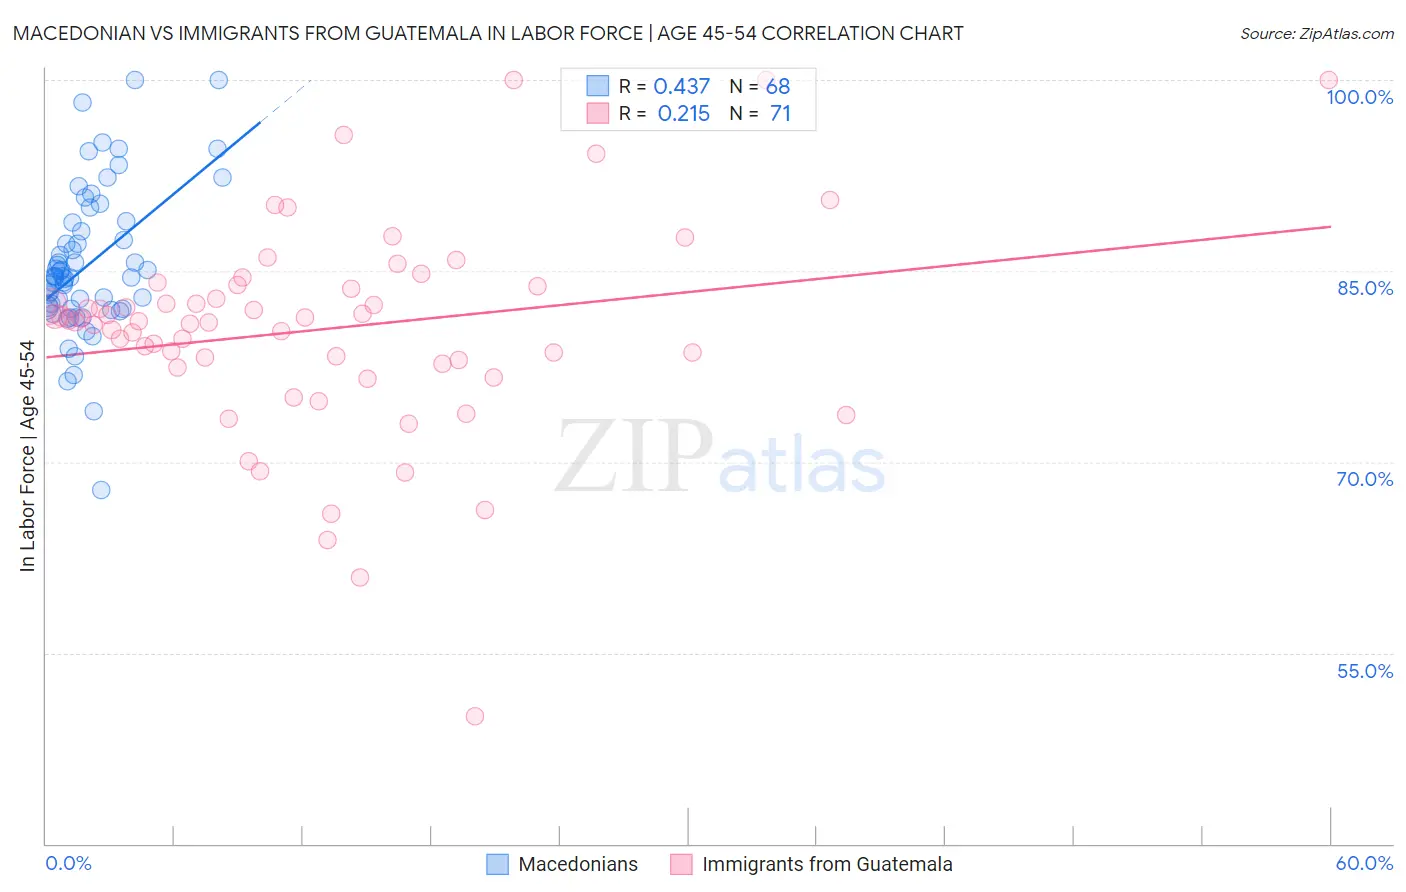
Macedonian vs Immigrants from Guatemala In Labor Force | Age 45-54 Correlation Chart
The statistical analysis conducted on geographies consisting of 132,596,520 people shows a moderate positive correlation between the proportion of Macedonians and labor force participation rate among population between the ages 45 and 54 in the United States with a correlation coefficient (R) of 0.437 and weighted average of 83.5%. Similarly, the statistical analysis conducted on geographies consisting of 377,151,916 people shows a weak positive correlation between the proportion of Immigrants from Guatemala and labor force participation rate among population between the ages 45 and 54 in the United States with a correlation coefficient (R) of 0.215 and weighted average of 81.1%, a difference of 3.0%.
In Labor Force | Age 45-54 Correlation Summary
| Measurement | Macedonian | Immigrants from Guatemala |
| Minimum | 67.8% | 50.0% |
| Maximum | 100.0% | 100.0% |
| Range | 32.2% | 50.0% |
| Mean | 85.5% | 80.4% |
| Median | 84.5% | 81.1% |
| Interquartile 25% (IQ1) | 82.1% | 77.7% |
| Interquartile 75% (IQ3) | 88.5% | 83.8% |
| Interquartile Range (IQR) | 6.4% | 6.1% |
| Standard Deviation (Sample) | 5.8% | 8.3% |
| Standard Deviation (Population) | 5.7% | 8.3% |
Similar Demographics by In Labor Force | Age 45-54
Demographics Similar to Macedonians by In Labor Force | Age 45-54
In terms of in labor force | age 45-54, the demographic groups most similar to Macedonians are Somali (83.5%, a difference of 0.010%), Immigrants from Greece (83.6%, a difference of 0.020%), Immigrants from Turkey (83.6%, a difference of 0.020%), Polish (83.6%, a difference of 0.020%), and Peruvian (83.6%, a difference of 0.020%).
| Demographics | Rating | Rank | In Labor Force | Age 45-54 |
| Immigrants | Poland | 99.0 /100 | #48 | Exceptional 83.6% |
| Immigrants | Morocco | 99.0 /100 | #49 | Exceptional 83.6% |
| Immigrants | Greece | 98.8 /100 | #50 | Exceptional 83.6% |
| Immigrants | Turkey | 98.8 /100 | #51 | Exceptional 83.6% |
| Poles | 98.7 /100 | #52 | Exceptional 83.6% |
| Peruvians | 98.7 /100 | #53 | Exceptional 83.6% |
| Somalis | 98.7 /100 | #54 | Exceptional 83.5% |
| Macedonians | 98.7 /100 | #55 | Exceptional 83.5% |
| Immigrants | Peru | 98.6 /100 | #56 | Exceptional 83.5% |
| Paraguayans | 98.5 /100 | #57 | Exceptional 83.5% |
| Eastern Europeans | 98.5 /100 | #58 | Exceptional 83.5% |
| Bhutanese | 98.3 /100 | #59 | Exceptional 83.5% |
| Carpatho Rusyns | 98.3 /100 | #60 | Exceptional 83.5% |
| Filipinos | 98.3 /100 | #61 | Exceptional 83.5% |
| Immigrants | Taiwan | 98.0 /100 | #62 | Exceptional 83.5% |
Demographics Similar to Immigrants from Guatemala by In Labor Force | Age 45-54
In terms of in labor force | age 45-54, the demographic groups most similar to Immigrants from Guatemala are Immigrants from Micronesia (81.1%, a difference of 0.010%), Guatemalan (81.2%, a difference of 0.080%), U.S. Virgin Islander (81.2%, a difference of 0.10%), Immigrants from Latin America (81.0%, a difference of 0.11%), and Immigrants from Grenada (81.0%, a difference of 0.12%).
| Demographics | Rating | Rank | In Labor Force | Age 45-54 |
| Immigrants | Barbados | 0.0 /100 | #271 | Tragic 81.3% |
| Spanish | 0.0 /100 | #272 | Tragic 81.3% |
| Chippewa | 0.0 /100 | #273 | Tragic 81.3% |
| British West Indians | 0.0 /100 | #274 | Tragic 81.2% |
| Immigrants | Nonimmigrants | 0.0 /100 | #275 | Tragic 81.2% |
| U.S. Virgin Islanders | 0.0 /100 | #276 | Tragic 81.2% |
| Guatemalans | 0.0 /100 | #277 | Tragic 81.2% |
| Immigrants | Guatemala | 0.0 /100 | #278 | Tragic 81.1% |
| Immigrants | Micronesia | 0.0 /100 | #279 | Tragic 81.1% |
| Immigrants | Latin America | 0.0 /100 | #280 | Tragic 81.0% |
| Immigrants | Grenada | 0.0 /100 | #281 | Tragic 81.0% |
| Aleuts | 0.0 /100 | #282 | Tragic 81.0% |
| French American Indians | 0.0 /100 | #283 | Tragic 80.8% |
| Belizeans | 0.0 /100 | #284 | Tragic 80.8% |
| Delaware | 0.0 /100 | #285 | Tragic 80.8% |