Macedonian vs Paiute In Labor Force | Age 16-19
COMPARE
Macedonian
Paiute
In Labor Force | Age 16-19
In Labor Force | Age 16-19 Comparison
Macedonians
Paiute
37.8%
IN LABOR FORCE | AGE 16-19
93.4/ 100
METRIC RATING
135th/ 347
METRIC RANK
37.5%
IN LABOR FORCE | AGE 16-19
89.3/ 100
METRIC RATING
145th/ 347
METRIC RANK
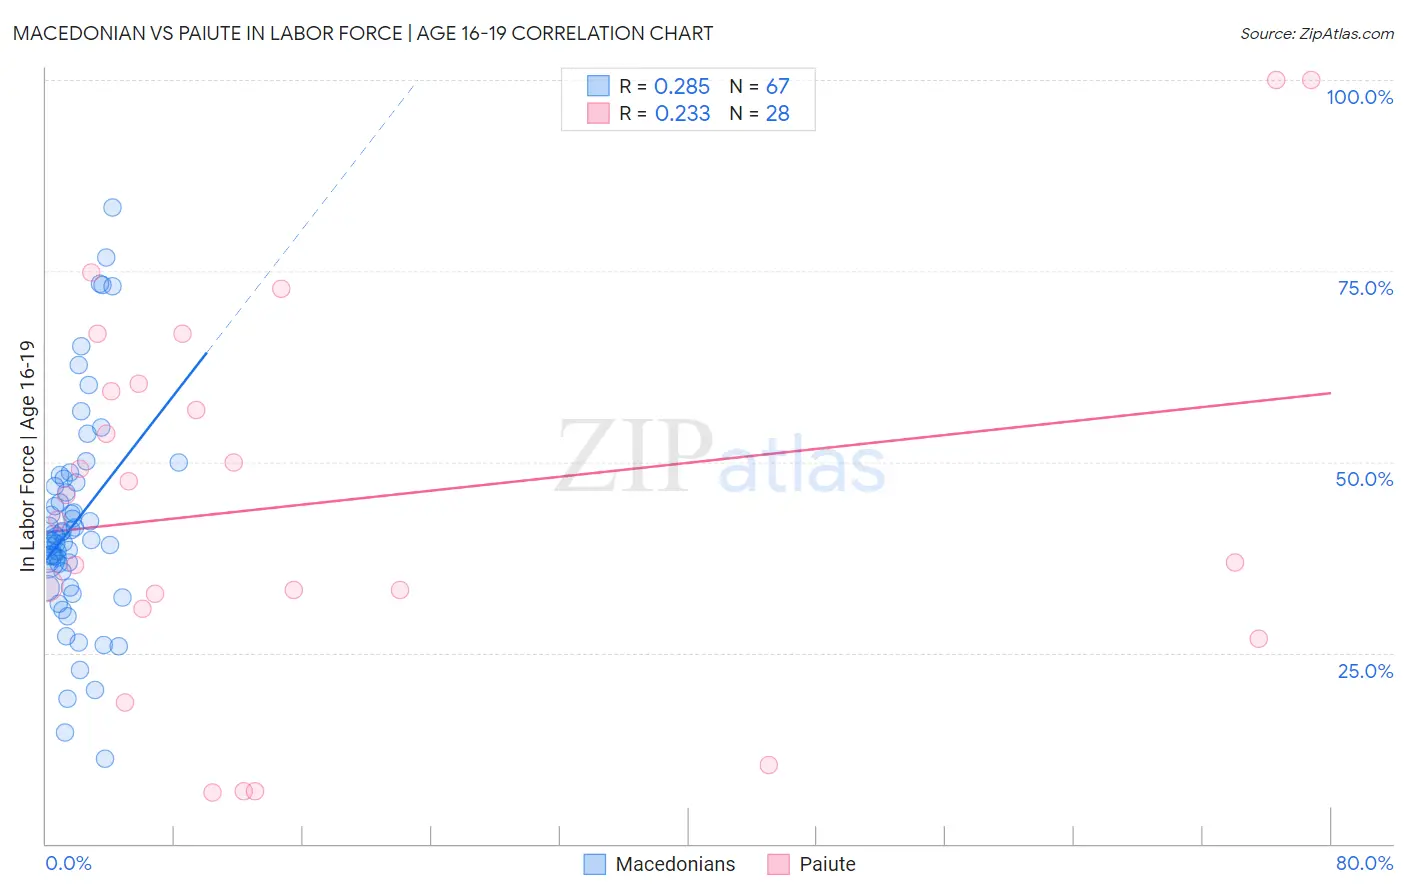
Macedonian vs Paiute In Labor Force | Age 16-19 Correlation Chart
The statistical analysis conducted on geographies consisting of 132,590,636 people shows a weak positive correlation between the proportion of Macedonians and labor force participation rate among population between the ages 16 and 19 in the United States with a correlation coefficient (R) of 0.285 and weighted average of 37.8%. Similarly, the statistical analysis conducted on geographies consisting of 58,354,197 people shows a weak positive correlation between the proportion of Paiute and labor force participation rate among population between the ages 16 and 19 in the United States with a correlation coefficient (R) of 0.233 and weighted average of 37.5%, a difference of 0.65%.
In Labor Force | Age 16-19 Correlation Summary
| Measurement | Macedonian | Paiute |
| Minimum | 11.2% | 6.7% |
| Maximum | 83.3% | 100.0% |
| Range | 72.1% | 93.3% |
| Mean | 41.9% | 45.0% |
| Median | 39.8% | 44.1% |
| Interquartile 25% (IQ1) | 35.7% | 31.7% |
| Interquartile 75% (IQ3) | 47.3% | 59.8% |
| Interquartile Range (IQR) | 11.5% | 28.1% |
| Standard Deviation (Sample) | 14.1% | 25.0% |
| Standard Deviation (Population) | 13.9% | 24.5% |
Demographics Similar to Macedonians and Paiute by In Labor Force | Age 16-19
In terms of in labor force | age 16-19, the demographic groups most similar to Macedonians are Australian (37.8%, a difference of 0.030%), Cajun (37.8%, a difference of 0.030%), Immigrants from Netherlands (37.8%, a difference of 0.060%), Comanche (37.7%, a difference of 0.26%), and Cheyenne (37.9%, a difference of 0.27%). Similarly, the demographic groups most similar to Paiute are Japanese (37.5%, a difference of 0.0%), Pakistani (37.6%, a difference of 0.020%), Sierra Leonean (37.6%, a difference of 0.050%), Immigrants from Western Europe (37.5%, a difference of 0.050%), and Brazilian (37.5%, a difference of 0.080%).
| Demographics | Rating | Rank | In Labor Force | Age 16-19 |
| Immigrants | Zimbabwe | 95.4 /100 | #130 | Exceptional 38.0% |
| Immigrants | Austria | 95.0 /100 | #131 | Exceptional 37.9% |
| Immigrants | Oceania | 94.7 /100 | #132 | Exceptional 37.9% |
| Cheyenne | 94.6 /100 | #133 | Exceptional 37.9% |
| Immigrants | Netherlands | 93.7 /100 | #134 | Exceptional 37.8% |
| Macedonians | 93.4 /100 | #135 | Exceptional 37.8% |
| Australians | 93.2 /100 | #136 | Exceptional 37.8% |
| Cajuns | 93.2 /100 | #137 | Exceptional 37.8% |
| Comanche | 91.9 /100 | #138 | Exceptional 37.7% |
| Immigrants | Moldova | 91.9 /100 | #139 | Exceptional 37.7% |
| Estonians | 91.7 /100 | #140 | Exceptional 37.7% |
| Syrians | 90.7 /100 | #141 | Exceptional 37.6% |
| Sierra Leoneans | 89.7 /100 | #142 | Excellent 37.6% |
| Pakistanis | 89.5 /100 | #143 | Excellent 37.6% |
| Japanese | 89.3 /100 | #144 | Excellent 37.5% |
| Paiute | 89.3 /100 | #145 | Excellent 37.5% |
| Immigrants | Western Europe | 88.9 /100 | #146 | Excellent 37.5% |
| Brazilians | 88.7 /100 | #147 | Excellent 37.5% |
| Romanians | 87.3 /100 | #148 | Excellent 37.5% |
| Native Hawaiians | 85.0 /100 | #149 | Excellent 37.4% |
| Tsimshian | 84.7 /100 | #150 | Excellent 37.4% |