Dutch West Indian vs Immigrants from Oceania In Labor Force | Age 20-64
COMPARE
Dutch West Indian
Immigrants from Oceania
In Labor Force | Age 20-64
In Labor Force | Age 20-64 Comparison
Dutch West Indians
Immigrants from Oceania
75.5%
IN LABOR FORCE | AGE 20-64
0.0/ 100
METRIC RATING
322nd/ 347
METRIC RANK
79.3%
IN LABOR FORCE | AGE 20-64
19.1/ 100
METRIC RATING
200th/ 347
METRIC RANK
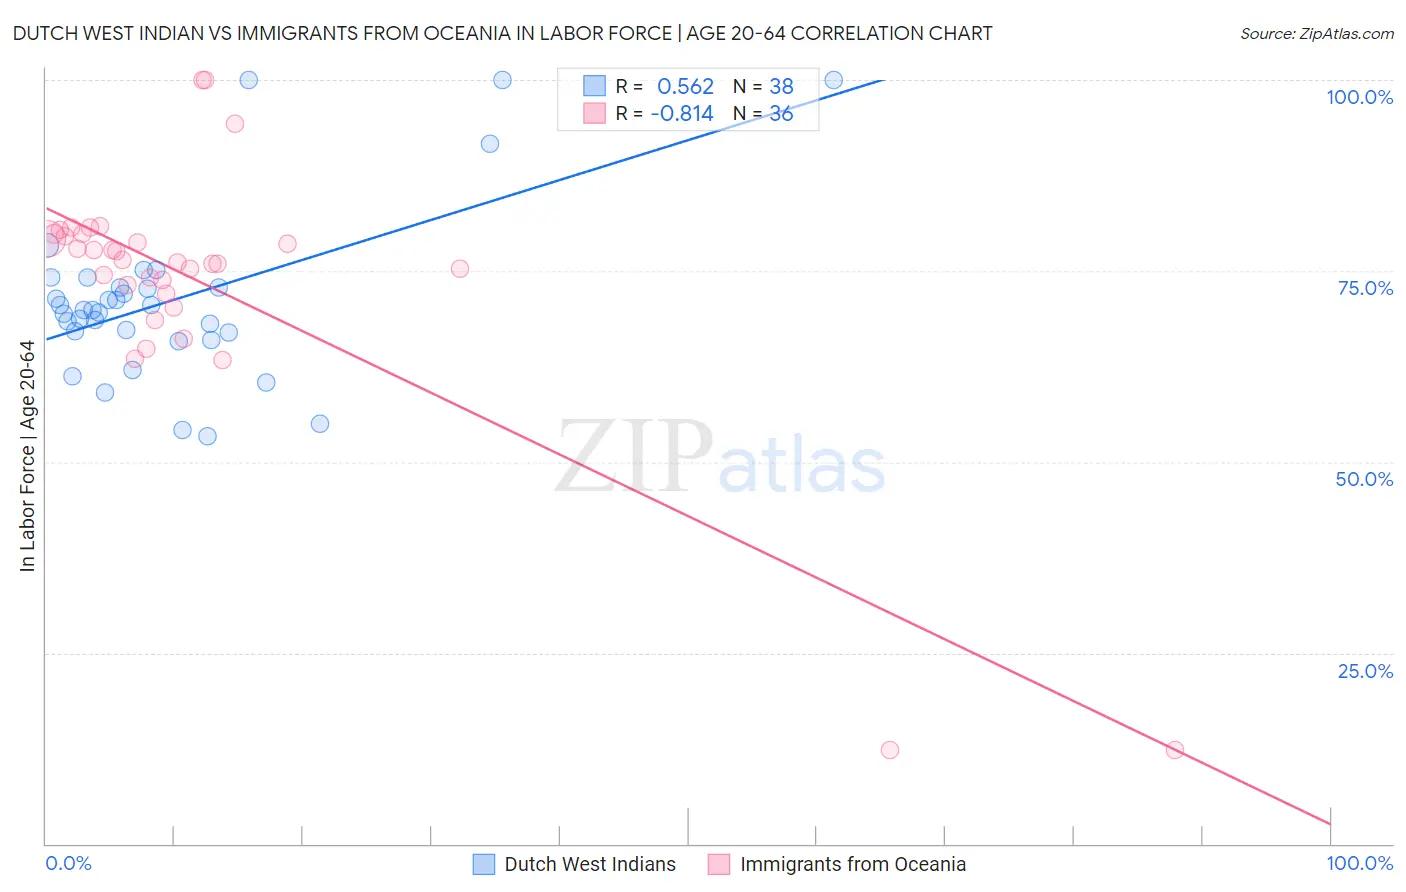
Dutch West Indian vs Immigrants from Oceania In Labor Force | Age 20-64 Correlation Chart
The statistical analysis conducted on geographies consisting of 85,770,451 people shows a substantial positive correlation between the proportion of Dutch West Indians and labor force participation rate among population between the ages 20 and 64 in the United States with a correlation coefficient (R) of 0.562 and weighted average of 75.5%. Similarly, the statistical analysis conducted on geographies consisting of 305,520,725 people shows a very strong negative correlation between the proportion of Immigrants from Oceania and labor force participation rate among population between the ages 20 and 64 in the United States with a correlation coefficient (R) of -0.814 and weighted average of 79.3%, a difference of 5.1%.
In Labor Force | Age 20-64 Correlation Summary
| Measurement | Dutch West Indian | Immigrants from Oceania |
| Minimum | 53.3% | 12.2% |
| Maximum | 100.0% | 100.0% |
| Range | 46.7% | 87.8% |
| Mean | 71.2% | 73.5% |
| Median | 69.9% | 76.3% |
| Interquartile 25% (IQ1) | 67.0% | 72.6% |
| Interquartile 75% (IQ3) | 72.9% | 79.7% |
| Interquartile Range (IQR) | 5.9% | 7.1% |
| Standard Deviation (Sample) | 11.0% | 17.1% |
| Standard Deviation (Population) | 10.9% | 16.9% |
Similar Demographics by In Labor Force | Age 20-64
Demographics Similar to Dutch West Indians by In Labor Force | Age 20-64
In terms of in labor force | age 20-64, the demographic groups most similar to Dutch West Indians are Cajun (75.5%, a difference of 0.040%), Seminole (75.5%, a difference of 0.050%), Choctaw (75.4%, a difference of 0.10%), Menominee (75.3%, a difference of 0.23%), and Yakama (75.8%, a difference of 0.40%).
| Demographics | Rating | Rank | In Labor Force | Age 20-64 |
| Ottawa | 0.0 /100 | #315 | Tragic 76.7% |
| Yaqui | 0.0 /100 | #316 | Tragic 76.5% |
| Cherokee | 0.0 /100 | #317 | Tragic 76.2% |
| Chickasaw | 0.0 /100 | #318 | Tragic 76.2% |
| Inupiat | 0.0 /100 | #319 | Tragic 76.1% |
| Yakama | 0.0 /100 | #320 | Tragic 75.8% |
| Seminole | 0.0 /100 | #321 | Tragic 75.5% |
| Dutch West Indians | 0.0 /100 | #322 | Tragic 75.5% |
| Cajuns | 0.0 /100 | #323 | Tragic 75.5% |
| Choctaw | 0.0 /100 | #324 | Tragic 75.4% |
| Menominee | 0.0 /100 | #325 | Tragic 75.3% |
| Creek | 0.0 /100 | #326 | Tragic 75.1% |
| Sioux | 0.0 /100 | #327 | Tragic 75.0% |
| Kiowa | 0.0 /100 | #328 | Tragic 75.0% |
| Cheyenne | 0.0 /100 | #329 | Tragic 74.8% |
Demographics Similar to Immigrants from Oceania by In Labor Force | Age 20-64
In terms of in labor force | age 20-64, the demographic groups most similar to Immigrants from Oceania are Immigrants from Nicaragua (79.3%, a difference of 0.0%), Dutch (79.3%, a difference of 0.010%), Nicaraguan (79.3%, a difference of 0.010%), Iraqi (79.3%, a difference of 0.020%), and Immigrants from Cambodia (79.3%, a difference of 0.020%).
| Demographics | Rating | Rank | In Labor Force | Age 20-64 |
| Indonesians | 26.1 /100 | #193 | Fair 79.4% |
| Immigrants | Thailand | 24.8 /100 | #194 | Fair 79.4% |
| Immigrants | Austria | 23.7 /100 | #195 | Fair 79.4% |
| Ecuadorians | 23.1 /100 | #196 | Fair 79.4% |
| Immigrants | Senegal | 22.5 /100 | #197 | Fair 79.4% |
| Immigrants | Laos | 21.5 /100 | #198 | Fair 79.4% |
| Dutch | 20.2 /100 | #199 | Fair 79.3% |
| Immigrants | Oceania | 19.1 /100 | #200 | Poor 79.3% |
| Immigrants | Nicaragua | 19.0 /100 | #201 | Poor 79.3% |
| Nicaraguans | 18.3 /100 | #202 | Poor 79.3% |
| Iraqis | 17.7 /100 | #203 | Poor 79.3% |
| Immigrants | Cambodia | 17.6 /100 | #204 | Poor 79.3% |
| Immigrants | Congo | 17.5 /100 | #205 | Poor 79.3% |
| Immigrants | Ecuador | 16.9 /100 | #206 | Poor 79.3% |
| Sub-Saharan Africans | 16.5 /100 | #207 | Poor 79.3% |