Swiss vs Immigrants from Oceania In Labor Force | Age 20-64
COMPARE
Swiss
Immigrants from Oceania
In Labor Force | Age 20-64
In Labor Force | Age 20-64 Comparison
Swiss
Immigrants from Oceania
79.4%
IN LABOR FORCE | AGE 20-64
28.9/ 100
METRIC RATING
191st/ 347
METRIC RANK
79.3%
IN LABOR FORCE | AGE 20-64
19.1/ 100
METRIC RATING
200th/ 347
METRIC RANK
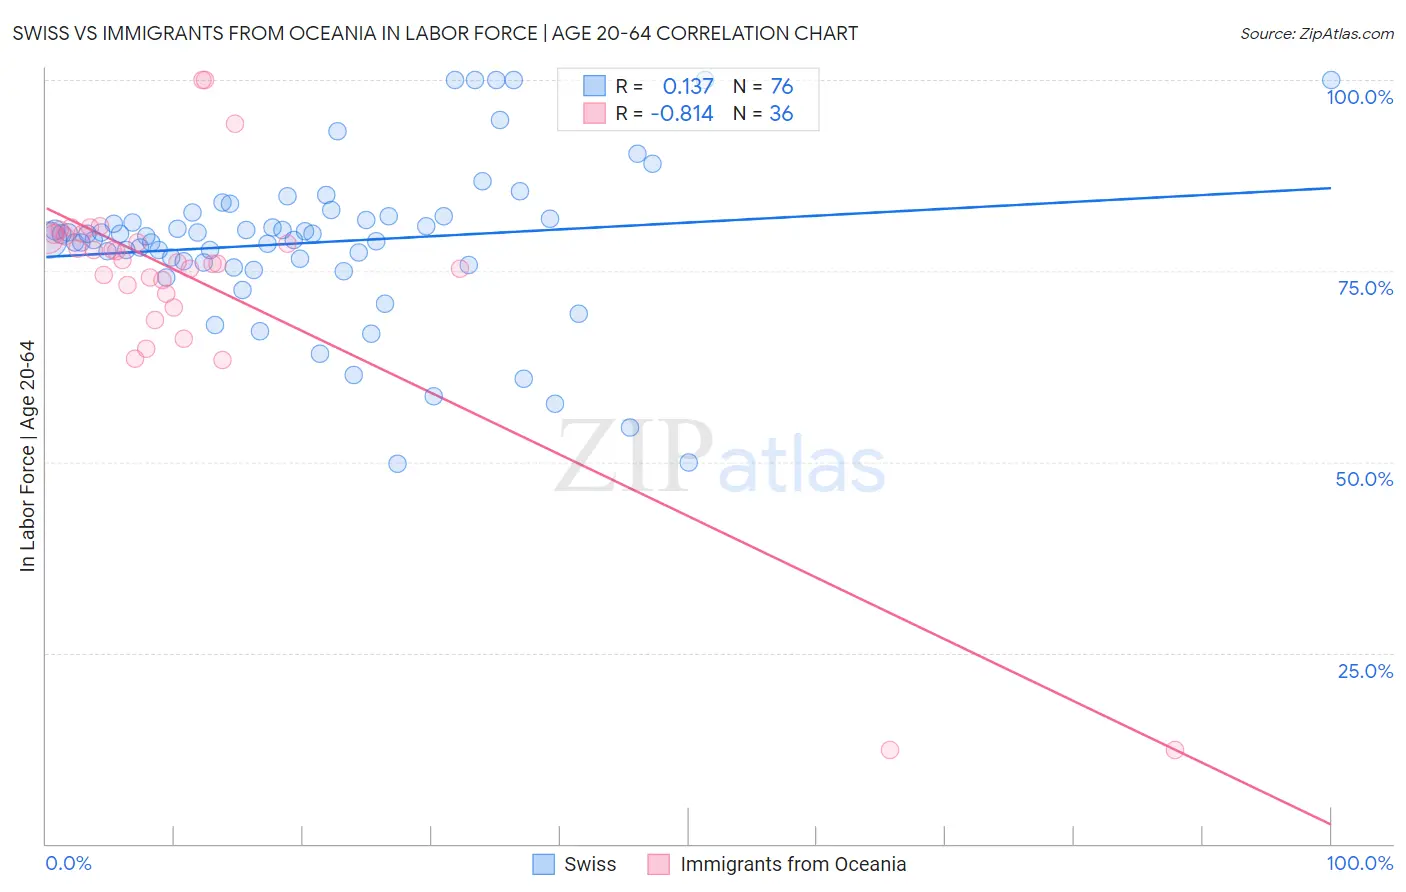
Swiss vs Immigrants from Oceania In Labor Force | Age 20-64 Correlation Chart
The statistical analysis conducted on geographies consisting of 465,041,286 people shows a poor positive correlation between the proportion of Swiss and labor force participation rate among population between the ages 20 and 64 in the United States with a correlation coefficient (R) of 0.137 and weighted average of 79.4%. Similarly, the statistical analysis conducted on geographies consisting of 305,520,725 people shows a very strong negative correlation between the proportion of Immigrants from Oceania and labor force participation rate among population between the ages 20 and 64 in the United States with a correlation coefficient (R) of -0.814 and weighted average of 79.3%, a difference of 0.11%.
In Labor Force | Age 20-64 Correlation Summary
| Measurement | Swiss | Immigrants from Oceania |
| Minimum | 49.7% | 12.2% |
| Maximum | 100.0% | 100.0% |
| Range | 50.3% | 87.8% |
| Mean | 78.8% | 73.5% |
| Median | 79.6% | 76.3% |
| Interquartile 25% (IQ1) | 76.0% | 72.6% |
| Interquartile 75% (IQ3) | 82.2% | 79.7% |
| Interquartile Range (IQR) | 6.2% | 7.1% |
| Standard Deviation (Sample) | 10.6% | 17.1% |
| Standard Deviation (Population) | 10.5% | 16.9% |
Demographics Similar to Swiss and Immigrants from Oceania by In Labor Force | Age 20-64
In terms of in labor force | age 20-64, the demographic groups most similar to Swiss are Immigrants from El Salvador (79.4%, a difference of 0.020%), Immigrants from Syria (79.4%, a difference of 0.020%), Immigrants from Denmark (79.4%, a difference of 0.020%), Immigrants from Haiti (79.4%, a difference of 0.030%), and Indonesian (79.4%, a difference of 0.030%). Similarly, the demographic groups most similar to Immigrants from Oceania are Immigrants from Nicaragua (79.3%, a difference of 0.0%), Dutch (79.3%, a difference of 0.010%), Nicaraguan (79.3%, a difference of 0.010%), Iraqi (79.3%, a difference of 0.020%), and Immigrants from Cambodia (79.3%, a difference of 0.020%).
| Demographics | Rating | Rank | In Labor Force | Age 20-64 |
| Israelis | 34.7 /100 | #185 | Fair 79.5% |
| Northern Europeans | 34.5 /100 | #186 | Fair 79.5% |
| Assyrians/Chaldeans/Syriacs | 33.3 /100 | #187 | Fair 79.4% |
| Immigrants | Haiti | 32.1 /100 | #188 | Fair 79.4% |
| Immigrants | El Salvador | 30.9 /100 | #189 | Fair 79.4% |
| Immigrants | Syria | 30.8 /100 | #190 | Fair 79.4% |
| Swiss | 28.9 /100 | #191 | Fair 79.4% |
| Immigrants | Denmark | 26.9 /100 | #192 | Fair 79.4% |
| Indonesians | 26.1 /100 | #193 | Fair 79.4% |
| Immigrants | Thailand | 24.8 /100 | #194 | Fair 79.4% |
| Immigrants | Austria | 23.7 /100 | #195 | Fair 79.4% |
| Ecuadorians | 23.1 /100 | #196 | Fair 79.4% |
| Immigrants | Senegal | 22.5 /100 | #197 | Fair 79.4% |
| Immigrants | Laos | 21.5 /100 | #198 | Fair 79.4% |
| Dutch | 20.2 /100 | #199 | Fair 79.3% |
| Immigrants | Oceania | 19.1 /100 | #200 | Poor 79.3% |
| Immigrants | Nicaragua | 19.0 /100 | #201 | Poor 79.3% |
| Nicaraguans | 18.3 /100 | #202 | Poor 79.3% |
| Iraqis | 17.7 /100 | #203 | Poor 79.3% |
| Immigrants | Cambodia | 17.6 /100 | #204 | Poor 79.3% |
| Immigrants | Congo | 17.5 /100 | #205 | Poor 79.3% |