Jamaican vs Immigrants from Oceania In Labor Force | Age 20-64
COMPARE
Jamaican
Immigrants from Oceania
In Labor Force | Age 20-64
In Labor Force | Age 20-64 Comparison
Jamaicans
Immigrants from Oceania
78.9%
IN LABOR FORCE | AGE 20-64
2.0/ 100
METRIC RATING
241st/ 347
METRIC RANK
79.3%
IN LABOR FORCE | AGE 20-64
19.1/ 100
METRIC RATING
200th/ 347
METRIC RANK
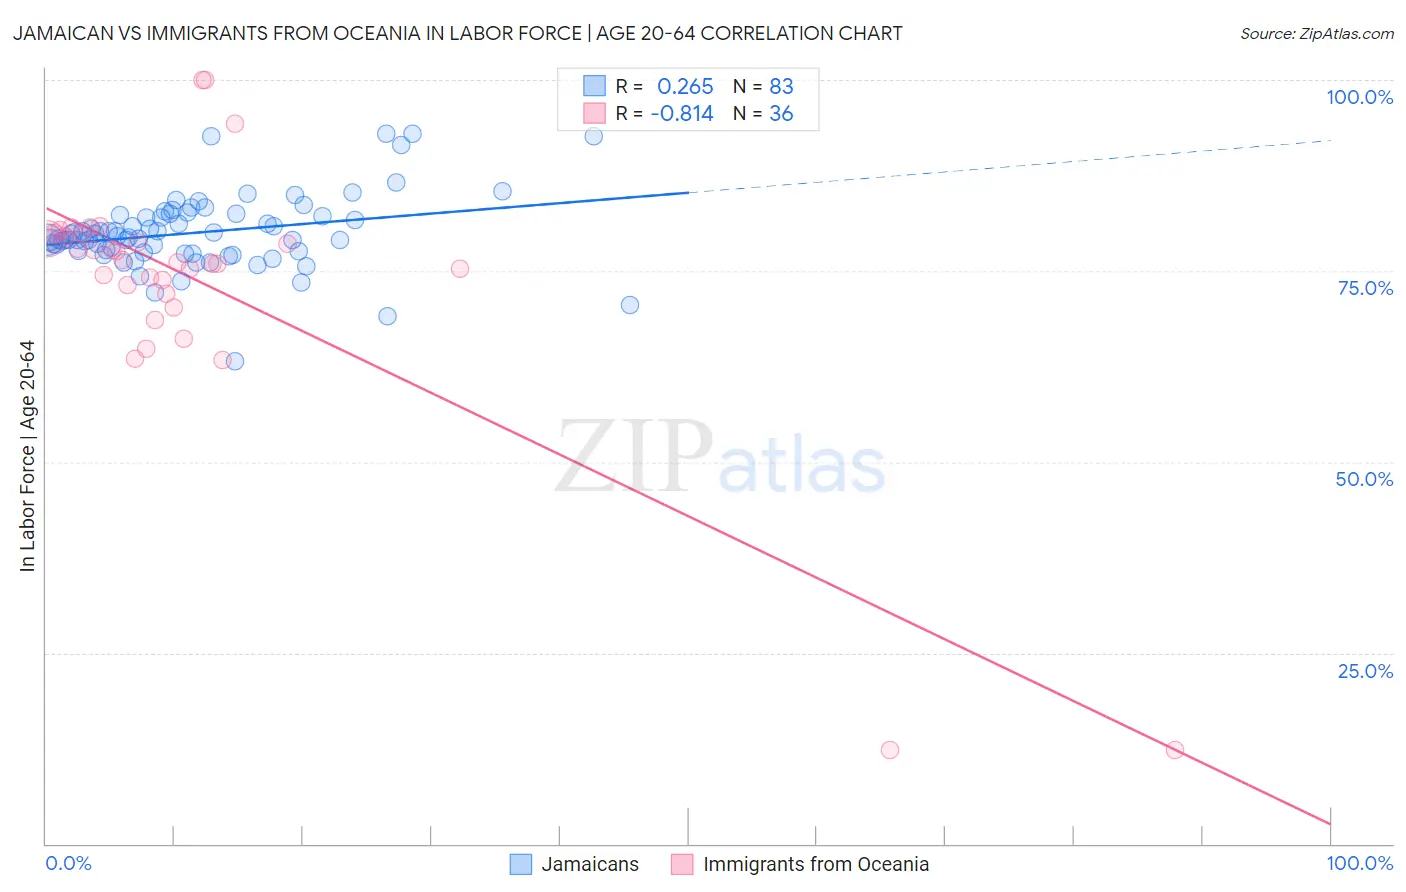
Jamaican vs Immigrants from Oceania In Labor Force | Age 20-64 Correlation Chart
The statistical analysis conducted on geographies consisting of 368,081,015 people shows a weak positive correlation between the proportion of Jamaicans and labor force participation rate among population between the ages 20 and 64 in the United States with a correlation coefficient (R) of 0.265 and weighted average of 78.9%. Similarly, the statistical analysis conducted on geographies consisting of 305,520,725 people shows a very strong negative correlation between the proportion of Immigrants from Oceania and labor force participation rate among population between the ages 20 and 64 in the United States with a correlation coefficient (R) of -0.814 and weighted average of 79.3%, a difference of 0.49%.
In Labor Force | Age 20-64 Correlation Summary
| Measurement | Jamaican | Immigrants from Oceania |
| Minimum | 63.2% | 12.2% |
| Maximum | 93.0% | 100.0% |
| Range | 29.8% | 87.8% |
| Mean | 80.0% | 73.5% |
| Median | 79.3% | 76.3% |
| Interquartile 25% (IQ1) | 77.6% | 72.6% |
| Interquartile 75% (IQ3) | 82.3% | 79.7% |
| Interquartile Range (IQR) | 4.7% | 7.1% |
| Standard Deviation (Sample) | 4.9% | 17.1% |
| Standard Deviation (Population) | 4.8% | 16.9% |
Similar Demographics by In Labor Force | Age 20-64
Demographics Similar to Jamaicans by In Labor Force | Age 20-64
In terms of in labor force | age 20-64, the demographic groups most similar to Jamaicans are Immigrants from Micronesia (78.9%, a difference of 0.010%), Trinidadian and Tobagonian (79.0%, a difference of 0.030%), Immigrants from West Indies (78.9%, a difference of 0.030%), Welsh (79.0%, a difference of 0.040%), and Immigrants from Jamaica (79.0%, a difference of 0.050%).
| Demographics | Rating | Rank | In Labor Force | Age 20-64 |
| Immigrants | Canada | 3.2 /100 | #234 | Tragic 79.0% |
| Tlingit-Haida | 3.2 /100 | #235 | Tragic 79.0% |
| Samoans | 2.9 /100 | #236 | Tragic 79.0% |
| Immigrants | North America | 2.9 /100 | #237 | Tragic 79.0% |
| Immigrants | Jamaica | 2.6 /100 | #238 | Tragic 79.0% |
| Welsh | 2.4 /100 | #239 | Tragic 79.0% |
| Trinidadians and Tobagonians | 2.3 /100 | #240 | Tragic 79.0% |
| Jamaicans | 2.0 /100 | #241 | Tragic 78.9% |
| Immigrants | Micronesia | 1.9 /100 | #242 | Tragic 78.9% |
| Immigrants | West Indies | 1.7 /100 | #243 | Tragic 78.9% |
| French | 1.5 /100 | #244 | Tragic 78.9% |
| Scottish | 1.3 /100 | #245 | Tragic 78.9% |
| Immigrants | Trinidad and Tobago | 1.1 /100 | #246 | Tragic 78.8% |
| Immigrants | Germany | 1.0 /100 | #247 | Tragic 78.8% |
| Immigrants | Caribbean | 1.0 /100 | #248 | Tragic 78.8% |
Demographics Similar to Immigrants from Oceania by In Labor Force | Age 20-64
In terms of in labor force | age 20-64, the demographic groups most similar to Immigrants from Oceania are Immigrants from Nicaragua (79.3%, a difference of 0.0%), Dutch (79.3%, a difference of 0.010%), Nicaraguan (79.3%, a difference of 0.010%), Iraqi (79.3%, a difference of 0.020%), and Immigrants from Cambodia (79.3%, a difference of 0.020%).
| Demographics | Rating | Rank | In Labor Force | Age 20-64 |
| Indonesians | 26.1 /100 | #193 | Fair 79.4% |
| Immigrants | Thailand | 24.8 /100 | #194 | Fair 79.4% |
| Immigrants | Austria | 23.7 /100 | #195 | Fair 79.4% |
| Ecuadorians | 23.1 /100 | #196 | Fair 79.4% |
| Immigrants | Senegal | 22.5 /100 | #197 | Fair 79.4% |
| Immigrants | Laos | 21.5 /100 | #198 | Fair 79.4% |
| Dutch | 20.2 /100 | #199 | Fair 79.3% |
| Immigrants | Oceania | 19.1 /100 | #200 | Poor 79.3% |
| Immigrants | Nicaragua | 19.0 /100 | #201 | Poor 79.3% |
| Nicaraguans | 18.3 /100 | #202 | Poor 79.3% |
| Iraqis | 17.7 /100 | #203 | Poor 79.3% |
| Immigrants | Cambodia | 17.6 /100 | #204 | Poor 79.3% |
| Immigrants | Congo | 17.5 /100 | #205 | Poor 79.3% |
| Immigrants | Ecuador | 16.9 /100 | #206 | Poor 79.3% |
| Sub-Saharan Africans | 16.5 /100 | #207 | Poor 79.3% |