South African vs Immigrants from Senegal In Labor Force | Age 16-19
COMPARE
South African
Immigrants from Senegal
In Labor Force | Age 16-19
In Labor Force | Age 16-19 Comparison
South Africans
Immigrants from Senegal
36.7%
IN LABOR FORCE | AGE 16-19
58.3/ 100
METRIC RATING
172nd/ 347
METRIC RANK
35.3%
IN LABOR FORCE | AGE 16-19
5.5/ 100
METRIC RATING
228th/ 347
METRIC RANK
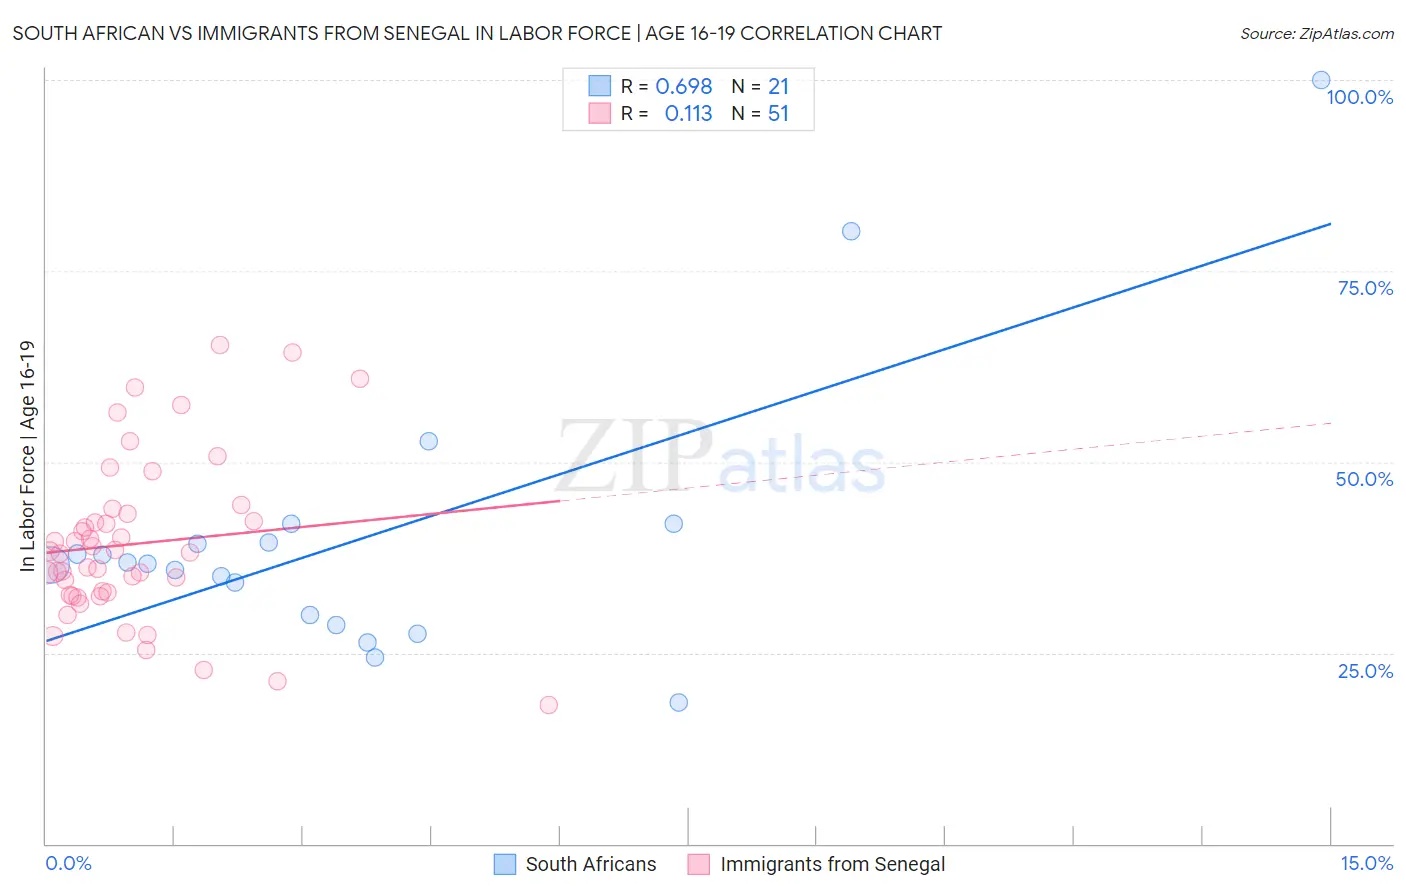
South African vs Immigrants from Senegal In Labor Force | Age 16-19 Correlation Chart
The statistical analysis conducted on geographies consisting of 182,382,145 people shows a significant positive correlation between the proportion of South Africans and labor force participation rate among population between the ages 16 and 19 in the United States with a correlation coefficient (R) of 0.698 and weighted average of 36.7%. Similarly, the statistical analysis conducted on geographies consisting of 90,105,312 people shows a poor positive correlation between the proportion of Immigrants from Senegal and labor force participation rate among population between the ages 16 and 19 in the United States with a correlation coefficient (R) of 0.113 and weighted average of 35.3%, a difference of 4.2%.
In Labor Force | Age 16-19 Correlation Summary
| Measurement | South African | Immigrants from Senegal |
| Minimum | 18.5% | 18.2% |
| Maximum | 100.0% | 65.3% |
| Range | 81.5% | 47.1% |
| Mean | 40.1% | 39.3% |
| Median | 36.7% | 38.2% |
| Interquartile 25% (IQ1) | 29.3% | 32.6% |
| Interquartile 75% (IQ3) | 40.7% | 43.1% |
| Interquartile Range (IQR) | 11.4% | 10.5% |
| Standard Deviation (Sample) | 18.4% | 10.6% |
| Standard Deviation (Population) | 18.0% | 10.5% |
Similar Demographics by In Labor Force | Age 16-19
Demographics Similar to South Africans by In Labor Force | Age 16-19
In terms of in labor force | age 16-19, the demographic groups most similar to South Africans are Immigrants from Cambodia (36.7%, a difference of 0.010%), Russian (36.7%, a difference of 0.040%), Immigrants from South Africa (36.8%, a difference of 0.11%), Immigrants from Latvia (36.8%, a difference of 0.17%), and Palestinian (36.8%, a difference of 0.25%).
| Demographics | Rating | Rank | In Labor Force | Age 16-19 |
| Yakama | 66.9 /100 | #165 | Good 36.9% |
| Immigrants | Western Africa | 66.7 /100 | #166 | Good 36.9% |
| Arabs | 63.6 /100 | #167 | Good 36.8% |
| Palestinians | 63.1 /100 | #168 | Good 36.8% |
| Immigrants | Latvia | 61.6 /100 | #169 | Good 36.8% |
| Immigrants | South Africa | 60.5 /100 | #170 | Good 36.8% |
| Immigrants | Cambodia | 58.4 /100 | #171 | Average 36.7% |
| South Africans | 58.3 /100 | #172 | Average 36.7% |
| Russians | 57.5 /100 | #173 | Average 36.7% |
| Immigrants | Czechoslovakia | 50.0 /100 | #174 | Average 36.6% |
| Natives/Alaskans | 49.0 /100 | #175 | Average 36.6% |
| Albanians | 48.8 /100 | #176 | Average 36.5% |
| Immigrants | Northern Europe | 46.6 /100 | #177 | Average 36.5% |
| Blacks/African Americans | 45.1 /100 | #178 | Average 36.5% |
| Immigrants | Southern Europe | 43.3 /100 | #179 | Average 36.4% |
Demographics Similar to Immigrants from Senegal by In Labor Force | Age 16-19
In terms of in labor force | age 16-19, the demographic groups most similar to Immigrants from Senegal are Mongolian (35.3%, a difference of 0.050%), Immigrants from Guatemala (35.3%, a difference of 0.060%), Immigrants from Lebanon (35.2%, a difference of 0.13%), Immigrants from Belgium (35.3%, a difference of 0.15%), and Immigrants from Honduras (35.2%, a difference of 0.16%).
| Demographics | Rating | Rank | In Labor Force | Age 16-19 |
| Turks | 7.3 /100 | #221 | Tragic 35.4% |
| Immigrants | Ghana | 7.3 /100 | #222 | Tragic 35.4% |
| Ghanaians | 6.5 /100 | #223 | Tragic 35.3% |
| Hondurans | 6.5 /100 | #224 | Tragic 35.3% |
| Immigrants | Belgium | 6.1 /100 | #225 | Tragic 35.3% |
| Immigrants | Guatemala | 5.7 /100 | #226 | Tragic 35.3% |
| Mongolians | 5.7 /100 | #227 | Tragic 35.3% |
| Immigrants | Senegal | 5.5 /100 | #228 | Tragic 35.3% |
| Immigrants | Lebanon | 5.0 /100 | #229 | Tragic 35.2% |
| Immigrants | Honduras | 4.9 /100 | #230 | Tragic 35.2% |
| Immigrants | Syria | 4.5 /100 | #231 | Tragic 35.2% |
| Immigrants | Kazakhstan | 4.5 /100 | #232 | Tragic 35.2% |
| Immigrants | France | 4.3 /100 | #233 | Tragic 35.1% |
| Immigrants | Mexico | 4.2 /100 | #234 | Tragic 35.1% |
| Immigrants | Philippines | 4.0 /100 | #235 | Tragic 35.1% |