Latvian vs Guatemalan In Labor Force | Age 30-34
COMPARE
Latvian
Guatemalan
In Labor Force | Age 30-34
In Labor Force | Age 30-34 Comparison
Latvians
Guatemalans
86.0%
IN LABOR FORCE | AGE 30-34
100.0/ 100
METRIC RATING
16th/ 347
METRIC RANK
83.7%
IN LABOR FORCE | AGE 30-34
0.2/ 100
METRIC RATING
264th/ 347
METRIC RANK
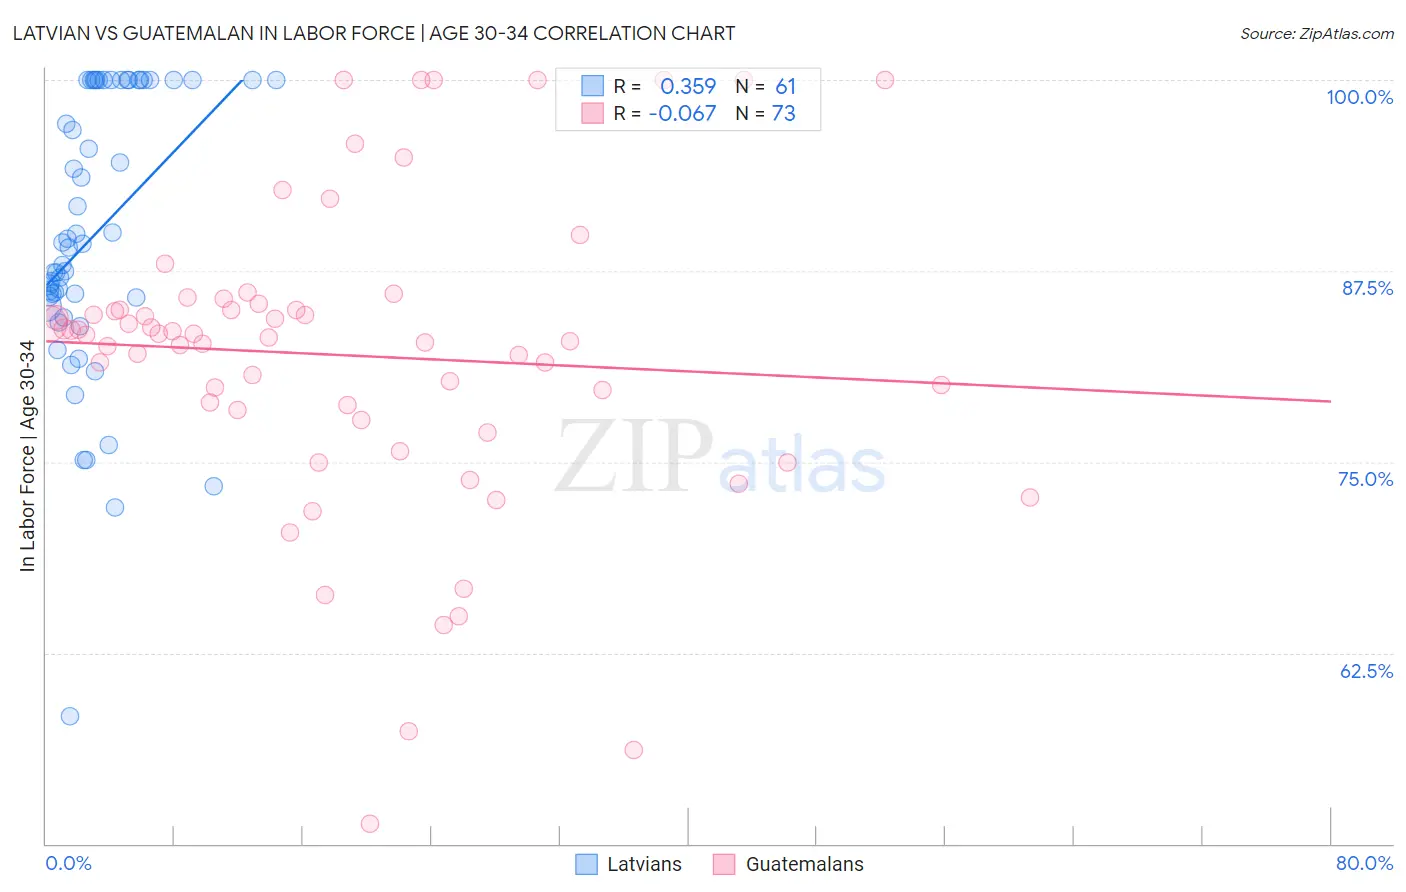
Latvian vs Guatemalan In Labor Force | Age 30-34 Correlation Chart
The statistical analysis conducted on geographies consisting of 220,645,666 people shows a mild positive correlation between the proportion of Latvians and labor force participation rate among population between the ages 30 and 34 in the United States with a correlation coefficient (R) of 0.359 and weighted average of 86.0%. Similarly, the statistical analysis conducted on geographies consisting of 409,343,950 people shows a slight negative correlation between the proportion of Guatemalans and labor force participation rate among population between the ages 30 and 34 in the United States with a correlation coefficient (R) of -0.067 and weighted average of 83.7%, a difference of 2.8%.
In Labor Force | Age 30-34 Correlation Summary
| Measurement | Latvian | Guatemalan |
| Minimum | 58.4% | 51.3% |
| Maximum | 100.0% | 100.0% |
| Range | 41.6% | 48.7% |
| Mean | 90.0% | 82.0% |
| Median | 89.3% | 83.3% |
| Interquartile 25% (IQ1) | 85.5% | 78.0% |
| Interquartile 75% (IQ3) | 100.0% | 85.1% |
| Interquartile Range (IQR) | 14.5% | 7.1% |
| Standard Deviation (Sample) | 9.1% | 10.0% |
| Standard Deviation (Population) | 9.1% | 9.9% |
Similar Demographics by In Labor Force | Age 30-34
Demographics Similar to Latvians by In Labor Force | Age 30-34
In terms of in labor force | age 30-34, the demographic groups most similar to Latvians are Immigrants from Cameroon (86.0%, a difference of 0.010%), Immigrants from Albania (86.1%, a difference of 0.030%), Immigrants from Cabo Verde (86.1%, a difference of 0.040%), Immigrants from Sierra Leone (86.0%, a difference of 0.040%), and Bolivian (86.1%, a difference of 0.060%).
| Demographics | Rating | Rank | In Labor Force | Age 30-34 |
| Immigrants | Somalia | 100.0 /100 | #9 | Exceptional 86.2% |
| Immigrants | Serbia | 100.0 /100 | #10 | Exceptional 86.2% |
| Carpatho Rusyns | 100.0 /100 | #11 | Exceptional 86.2% |
| Bolivians | 100.0 /100 | #12 | Exceptional 86.1% |
| Immigrants | Croatia | 100.0 /100 | #13 | Exceptional 86.1% |
| Immigrants | Cabo Verde | 100.0 /100 | #14 | Exceptional 86.1% |
| Immigrants | Albania | 100.0 /100 | #15 | Exceptional 86.1% |
| Latvians | 100.0 /100 | #16 | Exceptional 86.0% |
| Immigrants | Cameroon | 100.0 /100 | #17 | Exceptional 86.0% |
| Immigrants | Sierra Leone | 100.0 /100 | #18 | Exceptional 86.0% |
| Sierra Leoneans | 100.0 /100 | #19 | Exceptional 86.0% |
| Bulgarians | 100.0 /100 | #20 | Exceptional 86.0% |
| Immigrants | Bulgaria | 100.0 /100 | #21 | Exceptional 86.0% |
| Bermudans | 100.0 /100 | #22 | Exceptional 85.9% |
| Estonians | 100.0 /100 | #23 | Exceptional 85.9% |
Demographics Similar to Guatemalans by In Labor Force | Age 30-34
In terms of in labor force | age 30-34, the demographic groups most similar to Guatemalans are Immigrants from Honduras (83.7%, a difference of 0.030%), Dominican (83.8%, a difference of 0.050%), Immigrants from Guyana (83.8%, a difference of 0.050%), Immigrants from Guatemala (83.7%, a difference of 0.050%), and Guyanese (83.8%, a difference of 0.070%).
| Demographics | Rating | Rank | In Labor Force | Age 30-34 |
| Iraqis | 0.3 /100 | #257 | Tragic 83.8% |
| Hondurans | 0.3 /100 | #258 | Tragic 83.8% |
| Scotch-Irish | 0.3 /100 | #259 | Tragic 83.8% |
| Immigrants | Dominican Republic | 0.3 /100 | #260 | Tragic 83.8% |
| Guyanese | 0.3 /100 | #261 | Tragic 83.8% |
| Dominicans | 0.2 /100 | #262 | Tragic 83.8% |
| Immigrants | Guyana | 0.2 /100 | #263 | Tragic 83.8% |
| Guatemalans | 0.2 /100 | #264 | Tragic 83.7% |
| Immigrants | Honduras | 0.1 /100 | #265 | Tragic 83.7% |
| Immigrants | Guatemala | 0.1 /100 | #266 | Tragic 83.7% |
| Spaniards | 0.1 /100 | #267 | Tragic 83.6% |
| Immigrants | Bangladesh | 0.1 /100 | #268 | Tragic 83.6% |
| Vietnamese | 0.1 /100 | #269 | Tragic 83.6% |
| Spanish Americans | 0.0 /100 | #270 | Tragic 83.5% |
| Spanish | 0.0 /100 | #271 | Tragic 83.5% |