Lithuanian vs Samoan In Labor Force | Age 35-44
COMPARE
Lithuanian
Samoan
In Labor Force | Age 35-44
In Labor Force | Age 35-44 Comparison
Lithuanians
Samoans
85.2%
IN LABOR FORCE | AGE 35-44
99.8/ 100
METRIC RATING
44th/ 347
METRIC RANK
83.2%
IN LABOR FORCE | AGE 35-44
0.0/ 100
METRIC RATING
277th/ 347
METRIC RANK
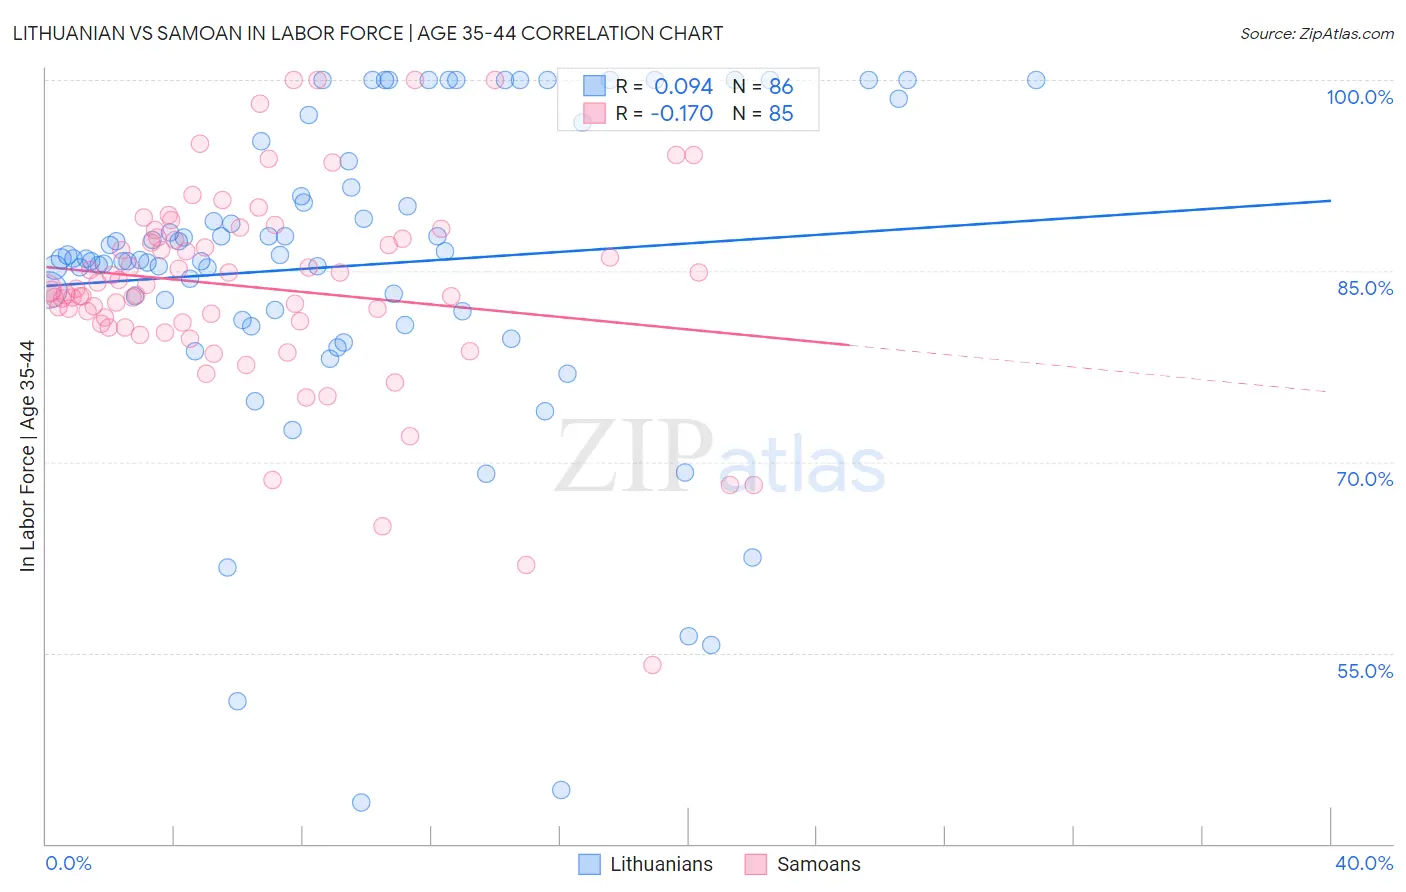
Lithuanian vs Samoan In Labor Force | Age 35-44 Correlation Chart
The statistical analysis conducted on geographies consisting of 421,725,431 people shows a slight positive correlation between the proportion of Lithuanians and labor force participation rate among population between the ages 35 and 44 in the United States with a correlation coefficient (R) of 0.094 and weighted average of 85.2%. Similarly, the statistical analysis conducted on geographies consisting of 225,132,853 people shows a poor negative correlation between the proportion of Samoans and labor force participation rate among population between the ages 35 and 44 in the United States with a correlation coefficient (R) of -0.170 and weighted average of 83.2%, a difference of 2.4%.
In Labor Force | Age 35-44 Correlation Summary
| Measurement | Lithuanian | Samoan |
| Minimum | 43.2% | 54.0% |
| Maximum | 100.0% | 100.0% |
| Range | 56.8% | 46.0% |
| Mean | 85.4% | 83.7% |
| Median | 86.0% | 83.6% |
| Interquartile 25% (IQ1) | 81.8% | 80.9% |
| Interquartile 75% (IQ3) | 93.7% | 87.6% |
| Interquartile Range (IQR) | 11.9% | 6.7% |
| Standard Deviation (Sample) | 12.5% | 7.9% |
| Standard Deviation (Population) | 12.4% | 7.9% |
Similar Demographics by In Labor Force | Age 35-44
Demographics Similar to Lithuanians by In Labor Force | Age 35-44
In terms of in labor force | age 35-44, the demographic groups most similar to Lithuanians are Polish (85.2%, a difference of 0.0%), Immigrants from Bulgaria (85.2%, a difference of 0.010%), Immigrants from Zimbabwe (85.2%, a difference of 0.010%), Macedonian (85.2%, a difference of 0.010%), and Cypriot (85.2%, a difference of 0.010%).
| Demographics | Rating | Rank | In Labor Force | Age 35-44 |
| Kenyans | 99.8 /100 | #37 | Exceptional 85.2% |
| Immigrants | Poland | 99.8 /100 | #38 | Exceptional 85.2% |
| Eastern Europeans | 99.8 /100 | #39 | Exceptional 85.2% |
| Immigrants | Bulgaria | 99.8 /100 | #40 | Exceptional 85.2% |
| Immigrants | Zimbabwe | 99.8 /100 | #41 | Exceptional 85.2% |
| Macedonians | 99.8 /100 | #42 | Exceptional 85.2% |
| Poles | 99.8 /100 | #43 | Exceptional 85.2% |
| Lithuanians | 99.8 /100 | #44 | Exceptional 85.2% |
| Cypriots | 99.8 /100 | #45 | Exceptional 85.2% |
| Immigrants | Hong Kong | 99.8 /100 | #46 | Exceptional 85.2% |
| German Russians | 99.8 /100 | #47 | Exceptional 85.2% |
| Immigrants | Eritrea | 99.7 /100 | #48 | Exceptional 85.2% |
| Croatians | 99.7 /100 | #49 | Exceptional 85.2% |
| Thais | 99.7 /100 | #50 | Exceptional 85.2% |
| Immigrants | Albania | 99.7 /100 | #51 | Exceptional 85.1% |
Demographics Similar to Samoans by In Labor Force | Age 35-44
In terms of in labor force | age 35-44, the demographic groups most similar to Samoans are Delaware (83.2%, a difference of 0.010%), Hawaiian (83.2%, a difference of 0.020%), Nonimmigrants (83.2%, a difference of 0.030%), Immigrants from Fiji (83.2%, a difference of 0.050%), and Spanish (83.2%, a difference of 0.050%).
| Demographics | Rating | Rank | In Labor Force | Age 35-44 |
| Immigrants | Honduras | 0.0 /100 | #270 | Tragic 83.3% |
| French American Indians | 0.0 /100 | #271 | Tragic 83.2% |
| Immigrants | Fiji | 0.0 /100 | #272 | Tragic 83.2% |
| Spanish | 0.0 /100 | #273 | Tragic 83.2% |
| Immigrants | Nonimmigrants | 0.0 /100 | #274 | Tragic 83.2% |
| Hawaiians | 0.0 /100 | #275 | Tragic 83.2% |
| Delaware | 0.0 /100 | #276 | Tragic 83.2% |
| Samoans | 0.0 /100 | #277 | Tragic 83.2% |
| Belizeans | 0.0 /100 | #278 | Tragic 83.1% |
| Immigrants | Micronesia | 0.0 /100 | #279 | Tragic 83.1% |
| Dominicans | 0.0 /100 | #280 | Tragic 83.1% |
| Guatemalans | 0.0 /100 | #281 | Tragic 83.0% |
| Osage | 0.0 /100 | #282 | Tragic 82.9% |
| Immigrants | Guatemala | 0.0 /100 | #283 | Tragic 82.9% |
| Immigrants | Dominican Republic | 0.0 /100 | #284 | Tragic 82.9% |