Lithuanian vs Immigrants from Costa Rica In Labor Force | Age 35-44
COMPARE
Lithuanian
Immigrants from Costa Rica
In Labor Force | Age 35-44
In Labor Force | Age 35-44 Comparison
Lithuanians
Immigrants from Costa Rica
85.2%
IN LABOR FORCE | AGE 35-44
99.8/ 100
METRIC RATING
44th/ 347
METRIC RANK
84.2%
IN LABOR FORCE | AGE 35-44
19.5/ 100
METRIC RATING
206th/ 347
METRIC RANK
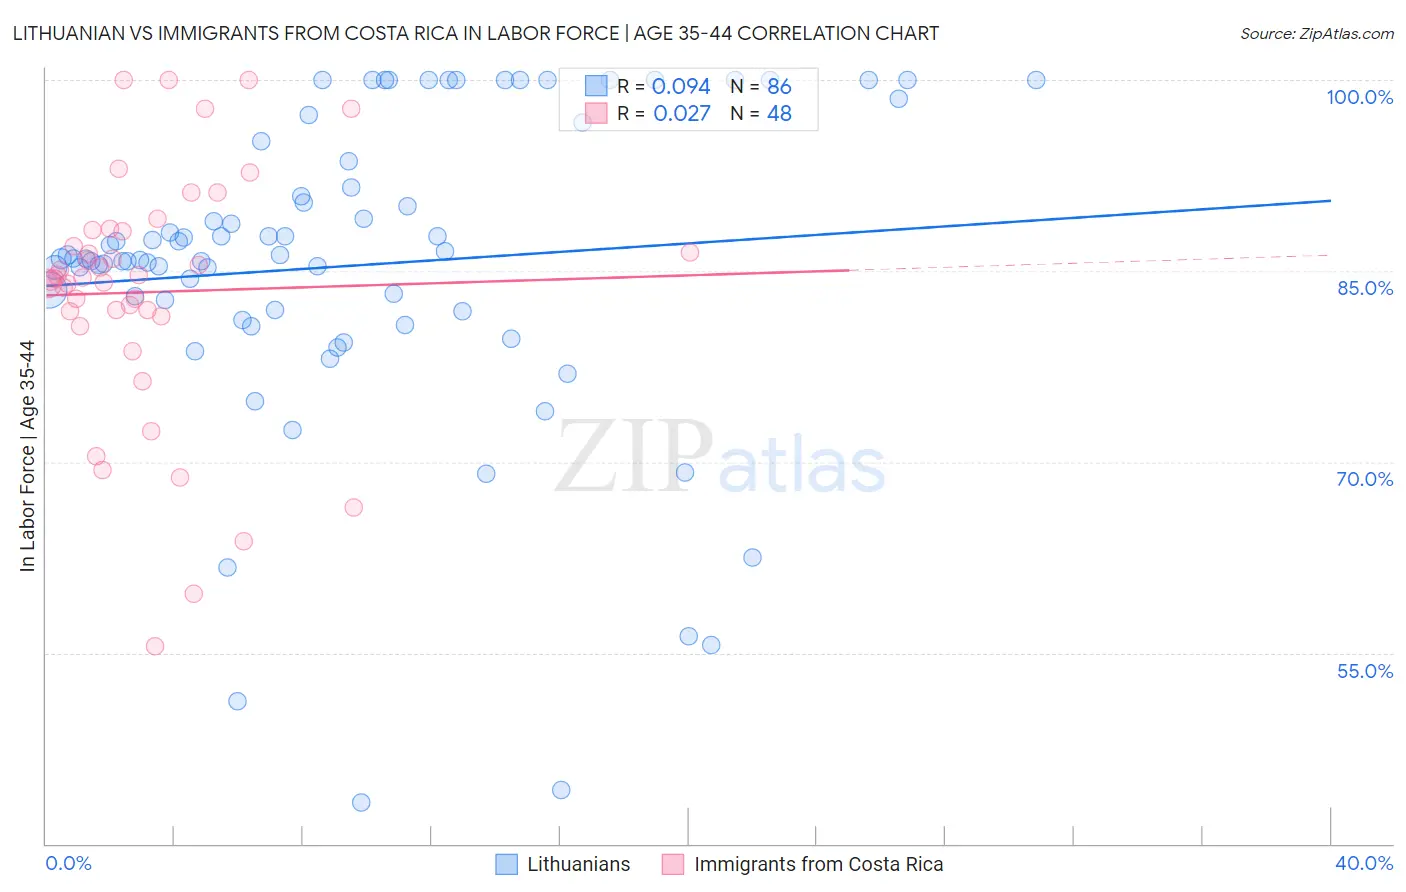
Lithuanian vs Immigrants from Costa Rica In Labor Force | Age 35-44 Correlation Chart
The statistical analysis conducted on geographies consisting of 421,725,431 people shows a slight positive correlation between the proportion of Lithuanians and labor force participation rate among population between the ages 35 and 44 in the United States with a correlation coefficient (R) of 0.094 and weighted average of 85.2%. Similarly, the statistical analysis conducted on geographies consisting of 204,260,035 people shows no correlation between the proportion of Immigrants from Costa Rica and labor force participation rate among population between the ages 35 and 44 in the United States with a correlation coefficient (R) of 0.027 and weighted average of 84.2%, a difference of 1.2%.
In Labor Force | Age 35-44 Correlation Summary
| Measurement | Lithuanian | Immigrants from Costa Rica |
| Minimum | 43.2% | 55.5% |
| Maximum | 100.0% | 100.0% |
| Range | 56.8% | 44.5% |
| Mean | 85.4% | 83.3% |
| Median | 86.0% | 84.5% |
| Interquartile 25% (IQ1) | 81.8% | 81.6% |
| Interquartile 75% (IQ3) | 93.7% | 88.2% |
| Interquartile Range (IQR) | 11.9% | 6.5% |
| Standard Deviation (Sample) | 12.5% | 9.8% |
| Standard Deviation (Population) | 12.4% | 9.7% |
Similar Demographics by In Labor Force | Age 35-44
Demographics Similar to Lithuanians by In Labor Force | Age 35-44
In terms of in labor force | age 35-44, the demographic groups most similar to Lithuanians are Polish (85.2%, a difference of 0.0%), Immigrants from Bulgaria (85.2%, a difference of 0.010%), Immigrants from Zimbabwe (85.2%, a difference of 0.010%), Macedonian (85.2%, a difference of 0.010%), and Cypriot (85.2%, a difference of 0.010%).
| Demographics | Rating | Rank | In Labor Force | Age 35-44 |
| Kenyans | 99.8 /100 | #37 | Exceptional 85.2% |
| Immigrants | Poland | 99.8 /100 | #38 | Exceptional 85.2% |
| Eastern Europeans | 99.8 /100 | #39 | Exceptional 85.2% |
| Immigrants | Bulgaria | 99.8 /100 | #40 | Exceptional 85.2% |
| Immigrants | Zimbabwe | 99.8 /100 | #41 | Exceptional 85.2% |
| Macedonians | 99.8 /100 | #42 | Exceptional 85.2% |
| Poles | 99.8 /100 | #43 | Exceptional 85.2% |
| Lithuanians | 99.8 /100 | #44 | Exceptional 85.2% |
| Cypriots | 99.8 /100 | #45 | Exceptional 85.2% |
| Immigrants | Hong Kong | 99.8 /100 | #46 | Exceptional 85.2% |
| German Russians | 99.8 /100 | #47 | Exceptional 85.2% |
| Immigrants | Eritrea | 99.7 /100 | #48 | Exceptional 85.2% |
| Croatians | 99.7 /100 | #49 | Exceptional 85.2% |
| Thais | 99.7 /100 | #50 | Exceptional 85.2% |
| Immigrants | Albania | 99.7 /100 | #51 | Exceptional 85.1% |
Demographics Similar to Immigrants from Costa Rica by In Labor Force | Age 35-44
In terms of in labor force | age 35-44, the demographic groups most similar to Immigrants from Costa Rica are Canadian (84.2%, a difference of 0.0%), Immigrants from Canada (84.2%, a difference of 0.0%), Laotian (84.2%, a difference of 0.0%), Immigrants from North America (84.2%, a difference of 0.010%), and Swiss (84.2%, a difference of 0.020%).
| Demographics | Rating | Rank | In Labor Force | Age 35-44 |
| Syrians | 23.2 /100 | #199 | Fair 84.2% |
| Moroccans | 23.2 /100 | #200 | Fair 84.2% |
| British | 23.0 /100 | #201 | Fair 84.2% |
| Immigrants | Uzbekistan | 22.8 /100 | #202 | Fair 84.2% |
| Immigrants | South Eastern Asia | 22.4 /100 | #203 | Fair 84.2% |
| Canadians | 19.9 /100 | #204 | Poor 84.2% |
| Immigrants | Canada | 19.6 /100 | #205 | Poor 84.2% |
| Immigrants | Costa Rica | 19.5 /100 | #206 | Poor 84.2% |
| Laotians | 19.0 /100 | #207 | Poor 84.2% |
| Immigrants | North America | 18.1 /100 | #208 | Poor 84.2% |
| Swiss | 17.4 /100 | #209 | Poor 84.2% |
| New Zealanders | 16.2 /100 | #210 | Poor 84.1% |
| Immigrants | Ecuador | 15.2 /100 | #211 | Poor 84.1% |
| Israelis | 14.0 /100 | #212 | Poor 84.1% |
| Bangladeshis | 13.7 /100 | #213 | Poor 84.1% |