Indonesian vs Samoan In Labor Force | Age 35-44
COMPARE
Indonesian
Samoan
In Labor Force | Age 35-44
In Labor Force | Age 35-44 Comparison
Indonesians
Samoans
83.7%
IN LABOR FORCE | AGE 35-44
0.8/ 100
METRIC RATING
248th/ 347
METRIC RANK
83.2%
IN LABOR FORCE | AGE 35-44
0.0/ 100
METRIC RATING
277th/ 347
METRIC RANK
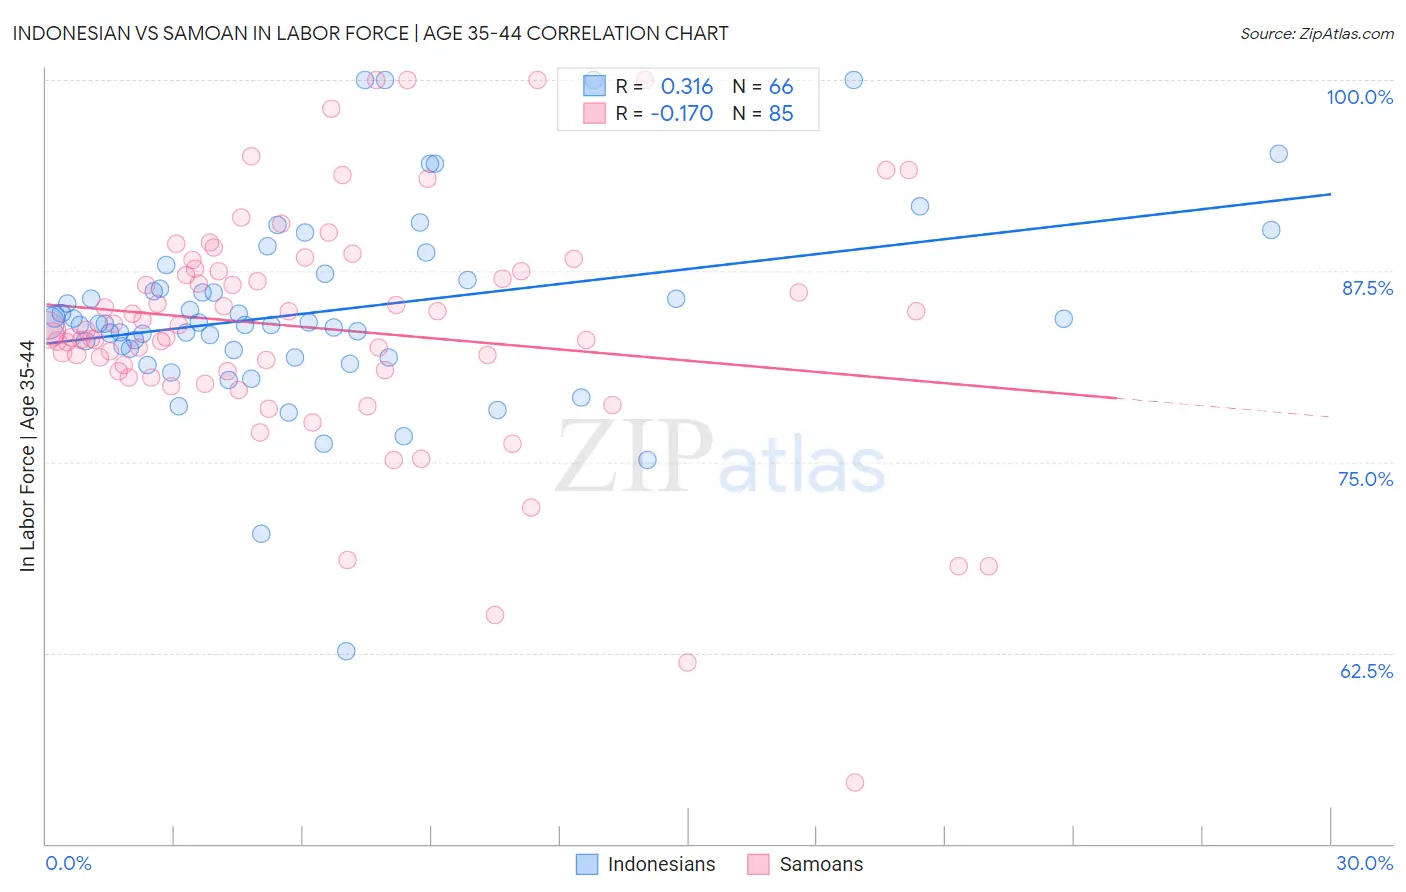
Indonesian vs Samoan In Labor Force | Age 35-44 Correlation Chart
The statistical analysis conducted on geographies consisting of 162,640,915 people shows a mild positive correlation between the proportion of Indonesians and labor force participation rate among population between the ages 35 and 44 in the United States with a correlation coefficient (R) of 0.316 and weighted average of 83.7%. Similarly, the statistical analysis conducted on geographies consisting of 225,132,853 people shows a poor negative correlation between the proportion of Samoans and labor force participation rate among population between the ages 35 and 44 in the United States with a correlation coefficient (R) of -0.170 and weighted average of 83.2%, a difference of 0.63%.
In Labor Force | Age 35-44 Correlation Summary
| Measurement | Indonesian | Samoan |
| Minimum | 62.6% | 54.0% |
| Maximum | 100.0% | 100.0% |
| Range | 37.4% | 46.0% |
| Mean | 84.8% | 83.7% |
| Median | 84.1% | 83.6% |
| Interquartile 25% (IQ1) | 82.3% | 80.9% |
| Interquartile 75% (IQ3) | 86.9% | 87.6% |
| Interquartile Range (IQR) | 4.6% | 6.7% |
| Standard Deviation (Sample) | 6.4% | 7.9% |
| Standard Deviation (Population) | 6.4% | 7.9% |
Similar Demographics by In Labor Force | Age 35-44
Demographics Similar to Indonesians by In Labor Force | Age 35-44
In terms of in labor force | age 35-44, the demographic groups most similar to Indonesians are Immigrants from Armenia (83.7%, a difference of 0.020%), Immigrants (83.7%, a difference of 0.030%), Immigrants from St. Vincent and the Grenadines (83.7%, a difference of 0.030%), Immigrants from Cambodia (83.8%, a difference of 0.050%), and Immigrants from Western Asia (83.8%, a difference of 0.050%).
| Demographics | Rating | Rank | In Labor Force | Age 35-44 |
| Iraqis | 1.3 /100 | #241 | Tragic 83.8% |
| Immigrants | Cambodia | 1.1 /100 | #242 | Tragic 83.8% |
| Immigrants | Western Asia | 1.1 /100 | #243 | Tragic 83.8% |
| Guyanese | 1.1 /100 | #244 | Tragic 83.8% |
| Malaysians | 1.1 /100 | #245 | Tragic 83.8% |
| Immigrants | Immigrants | 1.0 /100 | #246 | Tragic 83.7% |
| Immigrants | Armenia | 0.9 /100 | #247 | Tragic 83.7% |
| Indonesians | 0.8 /100 | #248 | Tragic 83.7% |
| Immigrants | St. Vincent and the Grenadines | 0.7 /100 | #249 | Tragic 83.7% |
| Whites/Caucasians | 0.5 /100 | #250 | Tragic 83.6% |
| Salvadorans | 0.4 /100 | #251 | Tragic 83.6% |
| Immigrants | Guyana | 0.4 /100 | #252 | Tragic 83.6% |
| Lebanese | 0.4 /100 | #253 | Tragic 83.6% |
| Tongans | 0.4 /100 | #254 | Tragic 83.6% |
| Immigrants | Azores | 0.3 /100 | #255 | Tragic 83.6% |
Demographics Similar to Samoans by In Labor Force | Age 35-44
In terms of in labor force | age 35-44, the demographic groups most similar to Samoans are Delaware (83.2%, a difference of 0.010%), Hawaiian (83.2%, a difference of 0.020%), Nonimmigrants (83.2%, a difference of 0.030%), Immigrants from Fiji (83.2%, a difference of 0.050%), and Spanish (83.2%, a difference of 0.050%).
| Demographics | Rating | Rank | In Labor Force | Age 35-44 |
| Immigrants | Honduras | 0.0 /100 | #270 | Tragic 83.3% |
| French American Indians | 0.0 /100 | #271 | Tragic 83.2% |
| Immigrants | Fiji | 0.0 /100 | #272 | Tragic 83.2% |
| Spanish | 0.0 /100 | #273 | Tragic 83.2% |
| Immigrants | Nonimmigrants | 0.0 /100 | #274 | Tragic 83.2% |
| Hawaiians | 0.0 /100 | #275 | Tragic 83.2% |
| Delaware | 0.0 /100 | #276 | Tragic 83.2% |
| Samoans | 0.0 /100 | #277 | Tragic 83.2% |
| Belizeans | 0.0 /100 | #278 | Tragic 83.1% |
| Immigrants | Micronesia | 0.0 /100 | #279 | Tragic 83.1% |
| Dominicans | 0.0 /100 | #280 | Tragic 83.1% |
| Guatemalans | 0.0 /100 | #281 | Tragic 83.0% |
| Osage | 0.0 /100 | #282 | Tragic 82.9% |
| Immigrants | Guatemala | 0.0 /100 | #283 | Tragic 82.9% |
| Immigrants | Dominican Republic | 0.0 /100 | #284 | Tragic 82.9% |