Lithuanian vs Immigrants from Southern Europe In Labor Force | Age 35-44
COMPARE
Lithuanian
Immigrants from Southern Europe
In Labor Force | Age 35-44
In Labor Force | Age 35-44 Comparison
Lithuanians
Immigrants from Southern Europe
85.2%
IN LABOR FORCE | AGE 35-44
99.8/ 100
METRIC RATING
44th/ 347
METRIC RANK
84.8%
IN LABOR FORCE | AGE 35-44
95.3/ 100
METRIC RATING
102nd/ 347
METRIC RANK
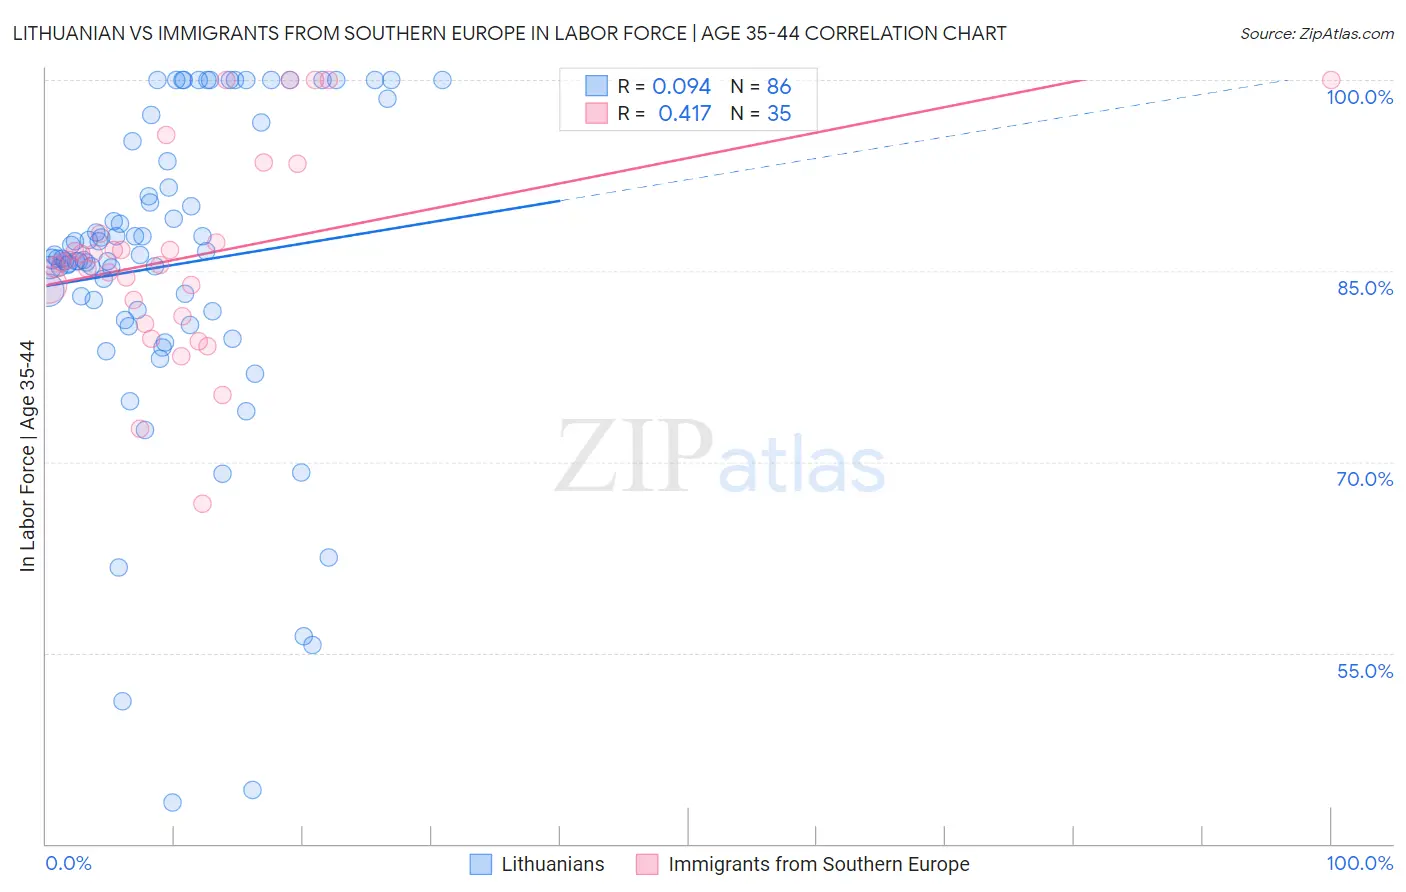
Lithuanian vs Immigrants from Southern Europe In Labor Force | Age 35-44 Correlation Chart
The statistical analysis conducted on geographies consisting of 421,725,431 people shows a slight positive correlation between the proportion of Lithuanians and labor force participation rate among population between the ages 35 and 44 in the United States with a correlation coefficient (R) of 0.094 and weighted average of 85.2%. Similarly, the statistical analysis conducted on geographies consisting of 402,651,691 people shows a moderate positive correlation between the proportion of Immigrants from Southern Europe and labor force participation rate among population between the ages 35 and 44 in the United States with a correlation coefficient (R) of 0.417 and weighted average of 84.8%, a difference of 0.51%.
In Labor Force | Age 35-44 Correlation Summary
| Measurement | Lithuanian | Immigrants from Southern Europe |
| Minimum | 43.2% | 66.7% |
| Maximum | 100.0% | 100.0% |
| Range | 56.8% | 33.3% |
| Mean | 85.4% | 86.2% |
| Median | 86.0% | 85.7% |
| Interquartile 25% (IQ1) | 81.8% | 81.4% |
| Interquartile 75% (IQ3) | 93.7% | 87.9% |
| Interquartile Range (IQR) | 11.9% | 6.5% |
| Standard Deviation (Sample) | 12.5% | 7.9% |
| Standard Deviation (Population) | 12.4% | 7.8% |
Similar Demographics by In Labor Force | Age 35-44
Demographics Similar to Lithuanians by In Labor Force | Age 35-44
In terms of in labor force | age 35-44, the demographic groups most similar to Lithuanians are Polish (85.2%, a difference of 0.0%), Immigrants from Bulgaria (85.2%, a difference of 0.010%), Immigrants from Zimbabwe (85.2%, a difference of 0.010%), Macedonian (85.2%, a difference of 0.010%), and Cypriot (85.2%, a difference of 0.010%).
| Demographics | Rating | Rank | In Labor Force | Age 35-44 |
| Kenyans | 99.8 /100 | #37 | Exceptional 85.2% |
| Immigrants | Poland | 99.8 /100 | #38 | Exceptional 85.2% |
| Eastern Europeans | 99.8 /100 | #39 | Exceptional 85.2% |
| Immigrants | Bulgaria | 99.8 /100 | #40 | Exceptional 85.2% |
| Immigrants | Zimbabwe | 99.8 /100 | #41 | Exceptional 85.2% |
| Macedonians | 99.8 /100 | #42 | Exceptional 85.2% |
| Poles | 99.8 /100 | #43 | Exceptional 85.2% |
| Lithuanians | 99.8 /100 | #44 | Exceptional 85.2% |
| Cypriots | 99.8 /100 | #45 | Exceptional 85.2% |
| Immigrants | Hong Kong | 99.8 /100 | #46 | Exceptional 85.2% |
| German Russians | 99.8 /100 | #47 | Exceptional 85.2% |
| Immigrants | Eritrea | 99.7 /100 | #48 | Exceptional 85.2% |
| Croatians | 99.7 /100 | #49 | Exceptional 85.2% |
| Thais | 99.7 /100 | #50 | Exceptional 85.2% |
| Immigrants | Albania | 99.7 /100 | #51 | Exceptional 85.1% |
Demographics Similar to Immigrants from Southern Europe by In Labor Force | Age 35-44
In terms of in labor force | age 35-44, the demographic groups most similar to Immigrants from Southern Europe are Immigrants from Belarus (84.8%, a difference of 0.0%), Immigrants from Sweden (84.8%, a difference of 0.0%), Immigrants from Australia (84.8%, a difference of 0.010%), South American (84.8%, a difference of 0.010%), and Haitian (84.8%, a difference of 0.020%).
| Demographics | Rating | Rank | In Labor Force | Age 35-44 |
| Immigrants | Kuwait | 96.7 /100 | #95 | Exceptional 84.8% |
| Cubans | 96.6 /100 | #96 | Exceptional 84.8% |
| Egyptians | 96.6 /100 | #97 | Exceptional 84.8% |
| Indians (Asian) | 96.1 /100 | #98 | Exceptional 84.8% |
| Haitians | 96.0 /100 | #99 | Exceptional 84.8% |
| Immigrants | Czechoslovakia | 95.9 /100 | #100 | Exceptional 84.8% |
| Immigrants | Australia | 95.5 /100 | #101 | Exceptional 84.8% |
| Immigrants | Southern Europe | 95.3 /100 | #102 | Exceptional 84.8% |
| Immigrants | Belarus | 95.3 /100 | #103 | Exceptional 84.8% |
| Immigrants | Sweden | 95.2 /100 | #104 | Exceptional 84.8% |
| South Americans | 95.0 /100 | #105 | Exceptional 84.8% |
| Immigrants | Bahamas | 94.8 /100 | #106 | Exceptional 84.8% |
| Immigrants | Romania | 94.7 /100 | #107 | Exceptional 84.8% |
| Immigrants | Argentina | 94.5 /100 | #108 | Exceptional 84.8% |
| Immigrants | Russia | 94.5 /100 | #109 | Exceptional 84.8% |