Immigrants from Kazakhstan vs Samoan In Labor Force | Age 35-44
COMPARE
Immigrants from Kazakhstan
Samoan
In Labor Force | Age 35-44
In Labor Force | Age 35-44 Comparison
Immigrants from Kazakhstan
Samoans
84.4%
IN LABOR FORCE | AGE 35-44
60.4/ 100
METRIC RATING
160th/ 347
METRIC RANK
83.2%
IN LABOR FORCE | AGE 35-44
0.0/ 100
METRIC RATING
277th/ 347
METRIC RANK
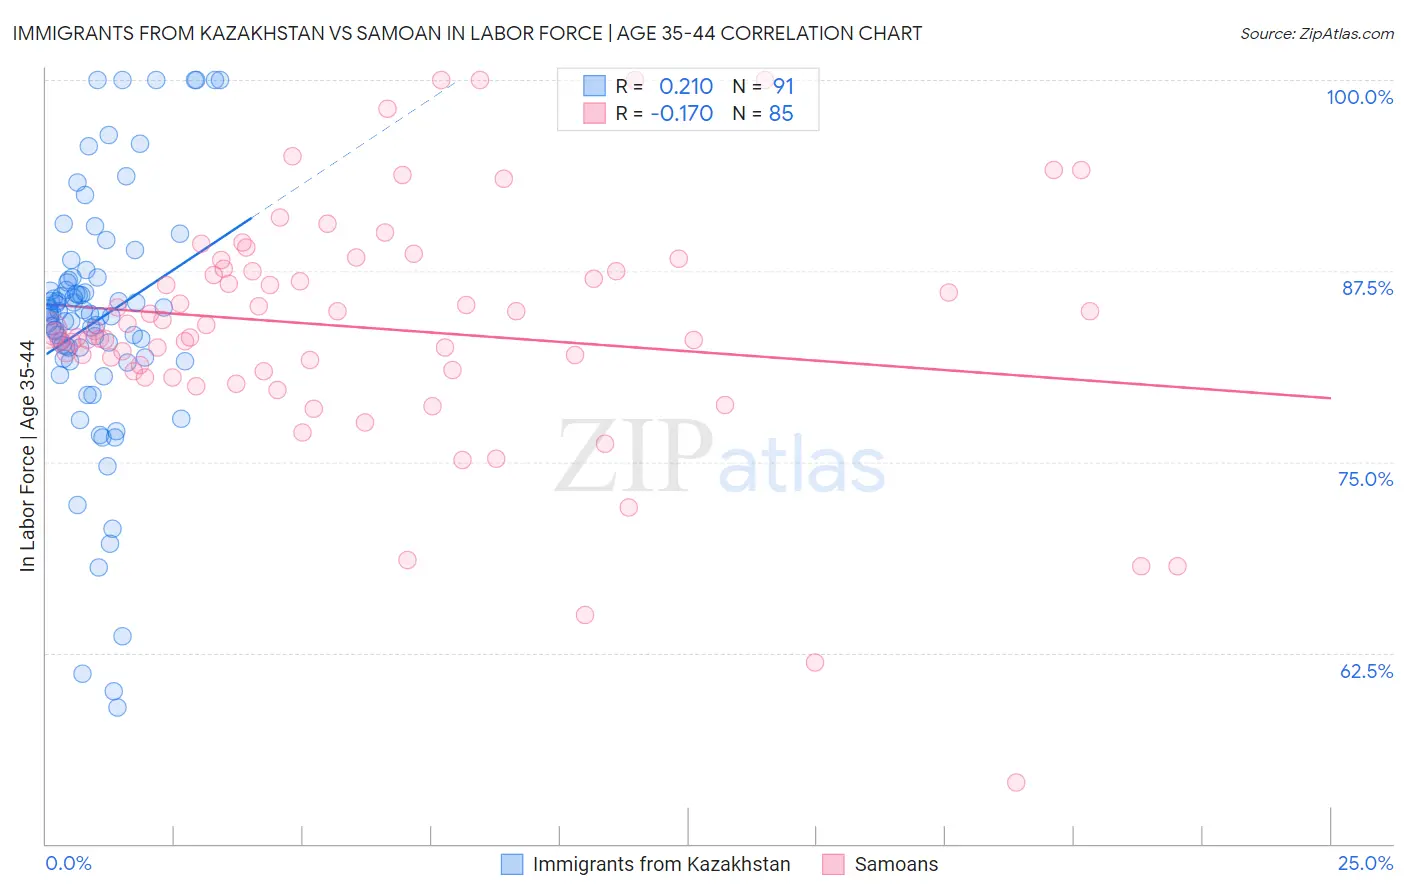
Immigrants from Kazakhstan vs Samoan In Labor Force | Age 35-44 Correlation Chart
The statistical analysis conducted on geographies consisting of 124,390,688 people shows a weak positive correlation between the proportion of Immigrants from Kazakhstan and labor force participation rate among population between the ages 35 and 44 in the United States with a correlation coefficient (R) of 0.210 and weighted average of 84.4%. Similarly, the statistical analysis conducted on geographies consisting of 225,132,853 people shows a poor negative correlation between the proportion of Samoans and labor force participation rate among population between the ages 35 and 44 in the United States with a correlation coefficient (R) of -0.170 and weighted average of 83.2%, a difference of 1.5%.
In Labor Force | Age 35-44 Correlation Summary
| Measurement | Immigrants from Kazakhstan | Samoan |
| Minimum | 58.9% | 54.0% |
| Maximum | 100.0% | 100.0% |
| Range | 41.1% | 46.0% |
| Mean | 84.2% | 83.7% |
| Median | 84.7% | 83.6% |
| Interquartile 25% (IQ1) | 81.8% | 80.9% |
| Interquartile 75% (IQ3) | 86.9% | 87.6% |
| Interquartile Range (IQR) | 5.1% | 6.7% |
| Standard Deviation (Sample) | 8.3% | 7.9% |
| Standard Deviation (Population) | 8.2% | 7.9% |
Similar Demographics by In Labor Force | Age 35-44
Demographics Similar to Immigrants from Kazakhstan by In Labor Force | Age 35-44
In terms of in labor force | age 35-44, the demographic groups most similar to Immigrants from Kazakhstan are Immigrants from Senegal (84.4%, a difference of 0.0%), Immigrants from Venezuela (84.4%, a difference of 0.0%), Immigrants from Hungary (84.4%, a difference of 0.010%), Aleut (84.4%, a difference of 0.010%), and Nigerian (84.4%, a difference of 0.010%).
| Demographics | Rating | Rank | In Labor Force | Age 35-44 |
| Trinidadians and Tobagonians | 69.5 /100 | #153 | Good 84.5% |
| Iranians | 69.4 /100 | #154 | Good 84.5% |
| Immigrants | Switzerland | 65.9 /100 | #155 | Good 84.5% |
| Immigrants | Israel | 64.3 /100 | #156 | Good 84.4% |
| Immigrants | Austria | 63.8 /100 | #157 | Good 84.4% |
| Jamaicans | 62.7 /100 | #158 | Good 84.4% |
| Immigrants | Senegal | 60.4 /100 | #159 | Good 84.4% |
| Immigrants | Kazakhstan | 60.4 /100 | #160 | Good 84.4% |
| Immigrants | Venezuela | 60.0 /100 | #161 | Good 84.4% |
| Immigrants | Hungary | 59.4 /100 | #162 | Average 84.4% |
| Aleuts | 59.1 /100 | #163 | Average 84.4% |
| Nigerians | 58.9 /100 | #164 | Average 84.4% |
| Venezuelans | 58.1 /100 | #165 | Average 84.4% |
| Alsatians | 55.2 /100 | #166 | Average 84.4% |
| Immigrants | Portugal | 55.2 /100 | #167 | Average 84.4% |
Demographics Similar to Samoans by In Labor Force | Age 35-44
In terms of in labor force | age 35-44, the demographic groups most similar to Samoans are Delaware (83.2%, a difference of 0.010%), Hawaiian (83.2%, a difference of 0.020%), Nonimmigrants (83.2%, a difference of 0.030%), Immigrants from Fiji (83.2%, a difference of 0.050%), and Spanish (83.2%, a difference of 0.050%).
| Demographics | Rating | Rank | In Labor Force | Age 35-44 |
| Immigrants | Honduras | 0.0 /100 | #270 | Tragic 83.3% |
| French American Indians | 0.0 /100 | #271 | Tragic 83.2% |
| Immigrants | Fiji | 0.0 /100 | #272 | Tragic 83.2% |
| Spanish | 0.0 /100 | #273 | Tragic 83.2% |
| Immigrants | Nonimmigrants | 0.0 /100 | #274 | Tragic 83.2% |
| Hawaiians | 0.0 /100 | #275 | Tragic 83.2% |
| Delaware | 0.0 /100 | #276 | Tragic 83.2% |
| Samoans | 0.0 /100 | #277 | Tragic 83.2% |
| Belizeans | 0.0 /100 | #278 | Tragic 83.1% |
| Immigrants | Micronesia | 0.0 /100 | #279 | Tragic 83.1% |
| Dominicans | 0.0 /100 | #280 | Tragic 83.1% |
| Guatemalans | 0.0 /100 | #281 | Tragic 83.0% |
| Osage | 0.0 /100 | #282 | Tragic 82.9% |
| Immigrants | Guatemala | 0.0 /100 | #283 | Tragic 82.9% |
| Immigrants | Dominican Republic | 0.0 /100 | #284 | Tragic 82.9% |