Spaniard vs Immigrants from South Africa In Labor Force | Age 35-44
COMPARE
Spaniard
Immigrants from South Africa
In Labor Force | Age 35-44
In Labor Force | Age 35-44 Comparison
Spaniards
Immigrants from South Africa
83.4%
IN LABOR FORCE | AGE 35-44
0.1/ 100
METRIC RATING
266th/ 347
METRIC RANK
84.3%
IN LABOR FORCE | AGE 35-44
42.8/ 100
METRIC RATING
179th/ 347
METRIC RANK
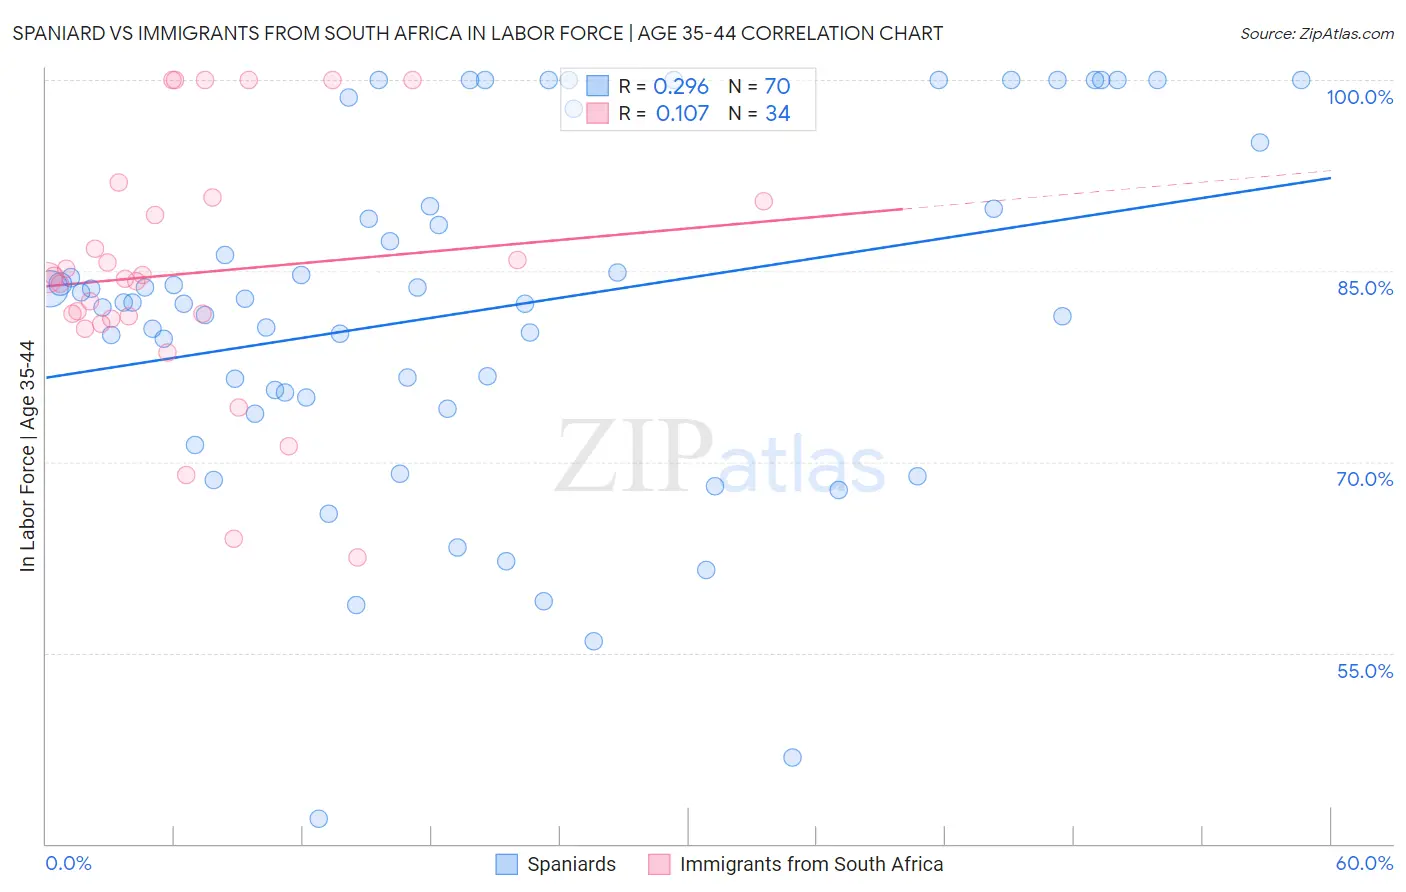
Spaniard vs Immigrants from South Africa In Labor Force | Age 35-44 Correlation Chart
The statistical analysis conducted on geographies consisting of 443,255,372 people shows a weak positive correlation between the proportion of Spaniards and labor force participation rate among population between the ages 35 and 44 in the United States with a correlation coefficient (R) of 0.296 and weighted average of 83.4%. Similarly, the statistical analysis conducted on geographies consisting of 233,278,888 people shows a poor positive correlation between the proportion of Immigrants from South Africa and labor force participation rate among population between the ages 35 and 44 in the United States with a correlation coefficient (R) of 0.107 and weighted average of 84.3%, a difference of 1.1%.
In Labor Force | Age 35-44 Correlation Summary
| Measurement | Spaniard | Immigrants from South Africa |
| Minimum | 41.9% | 62.5% |
| Maximum | 100.0% | 100.0% |
| Range | 58.1% | 37.5% |
| Mean | 81.9% | 84.8% |
| Median | 82.5% | 84.4% |
| Interquartile 25% (IQ1) | 75.0% | 81.3% |
| Interquartile 75% (IQ3) | 90.1% | 90.5% |
| Interquartile Range (IQR) | 15.1% | 9.2% |
| Standard Deviation (Sample) | 13.7% | 9.8% |
| Standard Deviation (Population) | 13.6% | 9.6% |
Similar Demographics by In Labor Force | Age 35-44
Demographics Similar to Spaniards by In Labor Force | Age 35-44
In terms of in labor force | age 35-44, the demographic groups most similar to Spaniards are Scotch-Irish (83.5%, a difference of 0.040%), Central American (83.5%, a difference of 0.040%), Guamanian/Chamorro (83.4%, a difference of 0.050%), Iroquois (83.5%, a difference of 0.070%), and Honduran (83.4%, a difference of 0.080%).
| Demographics | Rating | Rank | In Labor Force | Age 35-44 |
| Immigrants | El Salvador | 0.2 /100 | #259 | Tragic 83.5% |
| Vietnamese | 0.2 /100 | #260 | Tragic 83.5% |
| Immigrants | Dominica | 0.2 /100 | #261 | Tragic 83.5% |
| Immigrants | Congo | 0.2 /100 | #262 | Tragic 83.5% |
| Iroquois | 0.2 /100 | #263 | Tragic 83.5% |
| Scotch-Irish | 0.1 /100 | #264 | Tragic 83.5% |
| Central Americans | 0.1 /100 | #265 | Tragic 83.5% |
| Spaniards | 0.1 /100 | #266 | Tragic 83.4% |
| Guamanians/Chamorros | 0.1 /100 | #267 | Tragic 83.4% |
| Hondurans | 0.1 /100 | #268 | Tragic 83.4% |
| Immigrants | Grenada | 0.1 /100 | #269 | Tragic 83.3% |
| Immigrants | Honduras | 0.0 /100 | #270 | Tragic 83.3% |
| French American Indians | 0.0 /100 | #271 | Tragic 83.2% |
| Immigrants | Fiji | 0.0 /100 | #272 | Tragic 83.2% |
| Spanish | 0.0 /100 | #273 | Tragic 83.2% |
Demographics Similar to Immigrants from South Africa by In Labor Force | Age 35-44
In terms of in labor force | age 35-44, the demographic groups most similar to Immigrants from South Africa are French Canadian (84.3%, a difference of 0.010%), Northern European (84.3%, a difference of 0.010%), Sri Lankan (84.4%, a difference of 0.030%), Danish (84.3%, a difference of 0.030%), and Pakistani (84.4%, a difference of 0.040%).
| Demographics | Rating | Rank | In Labor Force | Age 35-44 |
| Scandinavians | 51.2 /100 | #172 | Average 84.4% |
| Immigrants | Trinidad and Tobago | 50.7 /100 | #173 | Average 84.4% |
| Immigrants | Iran | 50.0 /100 | #174 | Average 84.4% |
| Pakistanis | 48.2 /100 | #175 | Average 84.4% |
| Sri Lankans | 47.3 /100 | #176 | Average 84.4% |
| French Canadians | 44.3 /100 | #177 | Average 84.3% |
| Northern Europeans | 44.1 /100 | #178 | Average 84.3% |
| Immigrants | South Africa | 42.8 /100 | #179 | Average 84.3% |
| Danes | 38.8 /100 | #180 | Fair 84.3% |
| Immigrants | West Indies | 36.4 /100 | #181 | Fair 84.3% |
| Koreans | 36.3 /100 | #182 | Fair 84.3% |
| Barbadians | 36.2 /100 | #183 | Fair 84.3% |
| Armenians | 35.6 /100 | #184 | Fair 84.3% |
| Costa Ricans | 35.3 /100 | #185 | Fair 84.3% |
| Australians | 35.1 /100 | #186 | Fair 84.3% |