Immigrants from Liberia vs Central American Indian In Labor Force | Age 35-44
COMPARE
Immigrants from Liberia
Central American Indian
In Labor Force | Age 35-44
In Labor Force | Age 35-44 Comparison
Immigrants from Liberia
Central American Indians
85.4%
IN LABOR FORCE | AGE 35-44
99.9/ 100
METRIC RATING
26th/ 347
METRIC RANK
82.5%
IN LABOR FORCE | AGE 35-44
0.0/ 100
METRIC RATING
300th/ 347
METRIC RANK
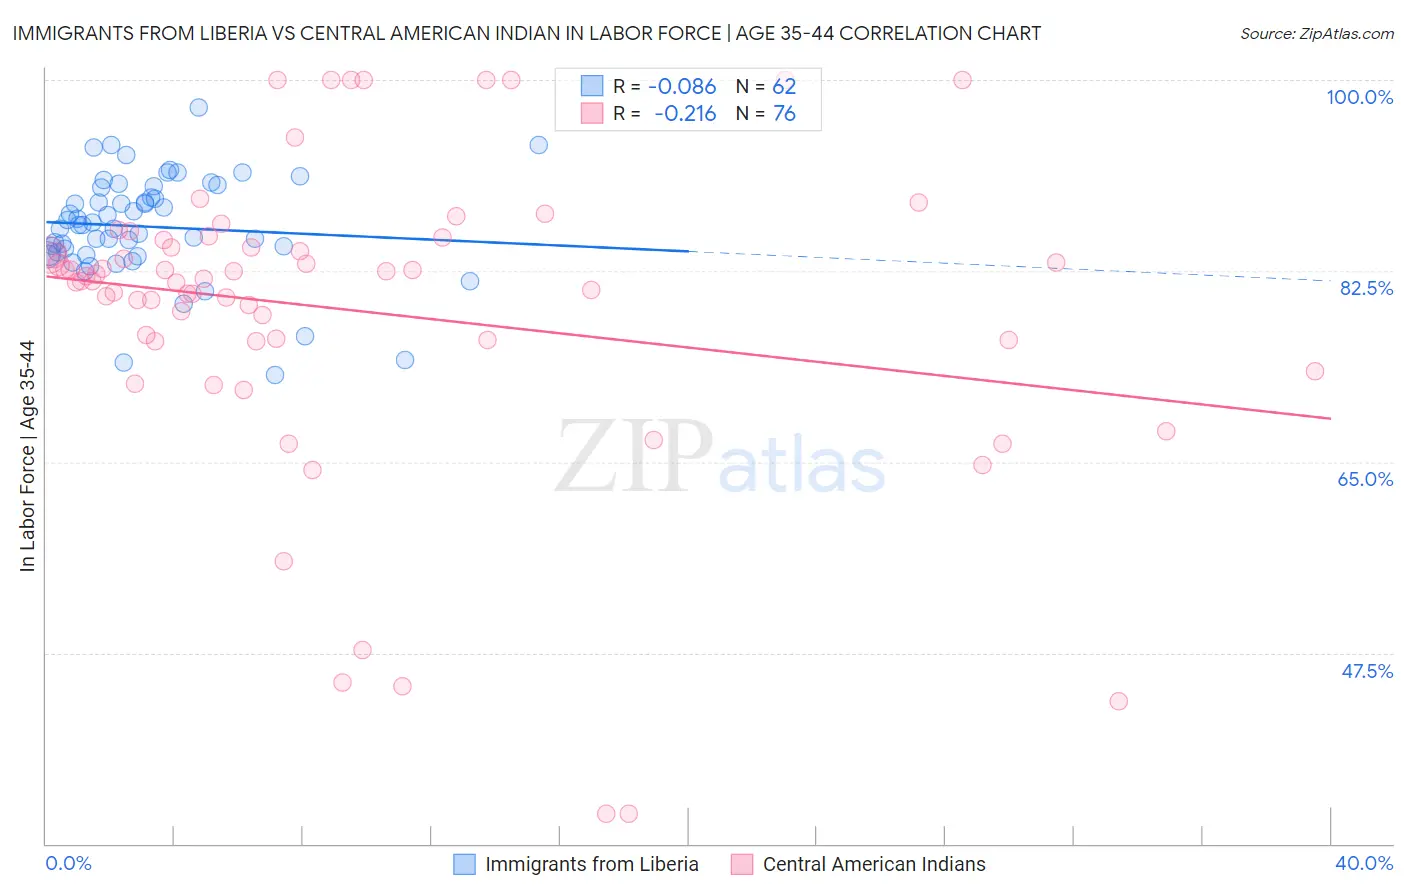
Immigrants from Liberia vs Central American Indian In Labor Force | Age 35-44 Correlation Chart
The statistical analysis conducted on geographies consisting of 135,260,455 people shows a slight negative correlation between the proportion of Immigrants from Liberia and labor force participation rate among population between the ages 35 and 44 in the United States with a correlation coefficient (R) of -0.086 and weighted average of 85.4%. Similarly, the statistical analysis conducted on geographies consisting of 326,103,474 people shows a weak negative correlation between the proportion of Central American Indians and labor force participation rate among population between the ages 35 and 44 in the United States with a correlation coefficient (R) of -0.216 and weighted average of 82.5%, a difference of 3.5%.
In Labor Force | Age 35-44 Correlation Summary
| Measurement | Immigrants from Liberia | Central American Indian |
| Minimum | 73.0% | 32.8% |
| Maximum | 97.5% | 100.0% |
| Range | 24.5% | 67.2% |
| Mean | 86.5% | 78.8% |
| Median | 86.7% | 81.7% |
| Interquartile 25% (IQ1) | 84.0% | 76.1% |
| Interquartile 75% (IQ3) | 90.2% | 85.0% |
| Interquartile Range (IQR) | 6.2% | 8.9% |
| Standard Deviation (Sample) | 4.8% | 14.3% |
| Standard Deviation (Population) | 4.8% | 14.3% |
Similar Demographics by In Labor Force | Age 35-44
Demographics Similar to Immigrants from Liberia by In Labor Force | Age 35-44
In terms of in labor force | age 35-44, the demographic groups most similar to Immigrants from Liberia are Paraguayan (85.4%, a difference of 0.0%), Immigrants from Lithuania (85.4%, a difference of 0.0%), Latvian (85.4%, a difference of 0.010%), Immigrants from Greece (85.3%, a difference of 0.020%), and Cambodian (85.3%, a difference of 0.050%).
| Demographics | Rating | Rank | In Labor Force | Age 35-44 |
| Slovenes | 100.0 /100 | #19 | Exceptional 85.6% |
| Immigrants | Serbia | 100.0 /100 | #20 | Exceptional 85.5% |
| Bulgarians | 100.0 /100 | #21 | Exceptional 85.5% |
| Immigrants | Bosnia and Herzegovina | 100.0 /100 | #22 | Exceptional 85.4% |
| Immigrants | Eastern Africa | 100.0 /100 | #23 | Exceptional 85.4% |
| Latvians | 99.9 /100 | #24 | Exceptional 85.4% |
| Paraguayans | 99.9 /100 | #25 | Exceptional 85.4% |
| Immigrants | Liberia | 99.9 /100 | #26 | Exceptional 85.4% |
| Immigrants | Lithuania | 99.9 /100 | #27 | Exceptional 85.4% |
| Immigrants | Greece | 99.9 /100 | #28 | Exceptional 85.3% |
| Cambodians | 99.9 /100 | #29 | Exceptional 85.3% |
| Bermudans | 99.9 /100 | #30 | Exceptional 85.3% |
| Czechs | 99.9 /100 | #31 | Exceptional 85.3% |
| Immigrants | India | 99.9 /100 | #32 | Exceptional 85.3% |
| Ugandans | 99.9 /100 | #33 | Exceptional 85.3% |
Demographics Similar to Central American Indians by In Labor Force | Age 35-44
In terms of in labor force | age 35-44, the demographic groups most similar to Central American Indians are Spanish American Indian (82.5%, a difference of 0.020%), Tlingit-Haida (82.5%, a difference of 0.070%), Ottawa (82.6%, a difference of 0.080%), Hmong (82.6%, a difference of 0.090%), and Mexican American Indian (82.6%, a difference of 0.10%).
| Demographics | Rating | Rank | In Labor Force | Age 35-44 |
| Spanish Americans | 0.0 /100 | #293 | Tragic 82.8% |
| Potawatomi | 0.0 /100 | #294 | Tragic 82.7% |
| Immigrants | Lebanon | 0.0 /100 | #295 | Tragic 82.7% |
| Mexican American Indians | 0.0 /100 | #296 | Tragic 82.6% |
| Hmong | 0.0 /100 | #297 | Tragic 82.6% |
| Ottawa | 0.0 /100 | #298 | Tragic 82.6% |
| Tlingit-Haida | 0.0 /100 | #299 | Tragic 82.5% |
| Central American Indians | 0.0 /100 | #300 | Tragic 82.5% |
| Spanish American Indians | 0.0 /100 | #301 | Tragic 82.5% |
| Americans | 0.0 /100 | #302 | Tragic 82.4% |
| Nepalese | 0.0 /100 | #303 | Tragic 82.4% |
| Marshallese | 0.0 /100 | #304 | Tragic 82.4% |
| Shoshone | 0.0 /100 | #305 | Tragic 82.2% |
| Blacks/African Americans | 0.0 /100 | #306 | Tragic 82.2% |
| Hispanics or Latinos | 0.0 /100 | #307 | Tragic 82.1% |