Immigrants from Malaysia vs Immigrants from Sri Lanka In Labor Force | Age 16-19
COMPARE
Immigrants from Malaysia
Immigrants from Sri Lanka
In Labor Force | Age 16-19
In Labor Force | Age 16-19 Comparison
Immigrants from Malaysia
Immigrants from Sri Lanka
34.3%
IN LABOR FORCE | AGE 16-19
0.7/ 100
METRIC RATING
266th/ 347
METRIC RANK
34.9%
IN LABOR FORCE | AGE 16-19
2.4/ 100
METRIC RATING
246th/ 347
METRIC RANK
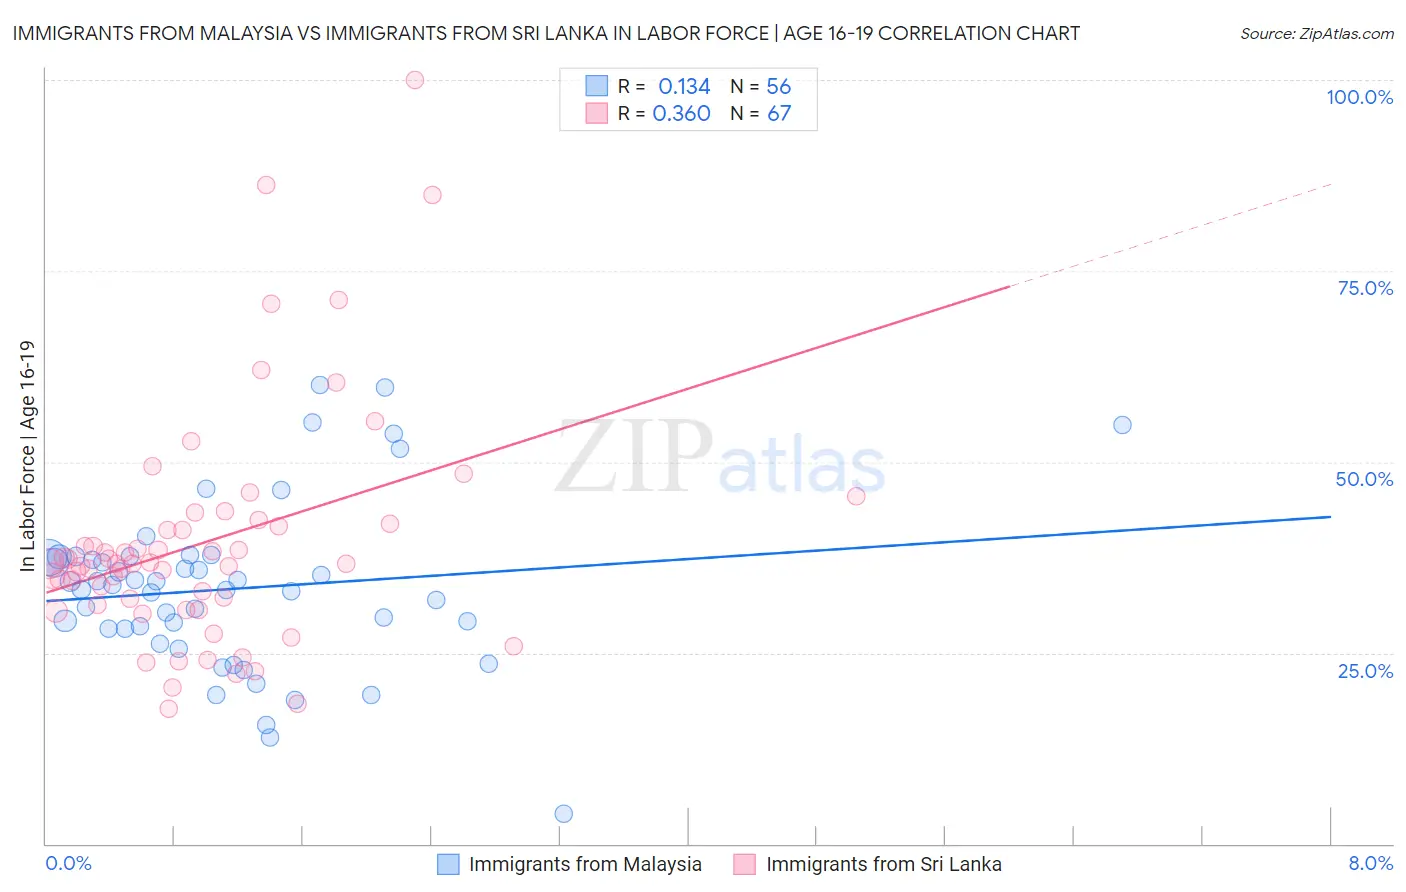
Immigrants from Malaysia vs Immigrants from Sri Lanka In Labor Force | Age 16-19 Correlation Chart
The statistical analysis conducted on geographies consisting of 197,895,635 people shows a poor positive correlation between the proportion of Immigrants from Malaysia and labor force participation rate among population between the ages 16 and 19 in the United States with a correlation coefficient (R) of 0.134 and weighted average of 34.3%. Similarly, the statistical analysis conducted on geographies consisting of 149,654,702 people shows a mild positive correlation between the proportion of Immigrants from Sri Lanka and labor force participation rate among population between the ages 16 and 19 in the United States with a correlation coefficient (R) of 0.360 and weighted average of 34.9%, a difference of 1.7%.
In Labor Force | Age 16-19 Correlation Summary
| Measurement | Immigrants from Malaysia | Immigrants from Sri Lanka |
| Minimum | 4.0% | 17.6% |
| Maximum | 60.1% | 100.0% |
| Range | 56.1% | 82.4% |
| Mean | 33.4% | 39.5% |
| Median | 33.6% | 36.7% |
| Interquartile 25% (IQ1) | 28.1% | 31.2% |
| Interquartile 75% (IQ3) | 37.5% | 41.9% |
| Interquartile Range (IQR) | 9.4% | 10.7% |
| Standard Deviation (Sample) | 11.0% | 15.4% |
| Standard Deviation (Population) | 10.9% | 15.3% |
Demographics Similar to Immigrants from Malaysia and Immigrants from Sri Lanka by In Labor Force | Age 16-19
In terms of in labor force | age 16-19, the demographic groups most similar to Immigrants from Malaysia are Immigrants from El Salvador (34.3%, a difference of 0.090%), Immigrants from Uruguay (34.4%, a difference of 0.33%), Burmese (34.5%, a difference of 0.61%), Salvadoran (34.5%, a difference of 0.66%), and Hispanic or Latino (34.5%, a difference of 0.66%). Similarly, the demographic groups most similar to Immigrants from Sri Lanka are Laotian (34.9%, a difference of 0.010%), Central American (34.8%, a difference of 0.090%), Immigrants from Ukraine (34.8%, a difference of 0.12%), Immigrants from Pakistan (34.8%, a difference of 0.22%), and Immigrants from Western Asia (34.8%, a difference of 0.24%).
| Demographics | Rating | Rank | In Labor Force | Age 16-19 |
| Immigrants | Sri Lanka | 2.4 /100 | #246 | Tragic 34.9% |
| Laotians | 2.4 /100 | #247 | Tragic 34.9% |
| Central Americans | 2.2 /100 | #248 | Tragic 34.8% |
| Immigrants | Ukraine | 2.2 /100 | #249 | Tragic 34.8% |
| Immigrants | Pakistan | 2.0 /100 | #250 | Tragic 34.8% |
| Immigrants | Western Asia | 2.0 /100 | #251 | Tragic 34.8% |
| Immigrants | Chile | 2.0 /100 | #252 | Tragic 34.8% |
| Immigrants | Japan | 1.5 /100 | #253 | Tragic 34.7% |
| Bahamians | 1.4 /100 | #254 | Tragic 34.6% |
| Peruvians | 1.4 /100 | #255 | Tragic 34.6% |
| Immigrants | South Central Asia | 1.3 /100 | #256 | Tragic 34.6% |
| Immigrants | Egypt | 1.2 /100 | #257 | Tragic 34.6% |
| Thais | 1.2 /100 | #258 | Tragic 34.6% |
| Immigrants | Immigrants | 1.2 /100 | #259 | Tragic 34.6% |
| Egyptians | 1.2 /100 | #260 | Tragic 34.5% |
| Salvadorans | 1.1 /100 | #261 | Tragic 34.5% |
| Hispanics or Latinos | 1.1 /100 | #262 | Tragic 34.5% |
| Burmese | 1.1 /100 | #263 | Tragic 34.5% |
| Immigrants | Uruguay | 0.9 /100 | #264 | Tragic 34.4% |
| Immigrants | El Salvador | 0.7 /100 | #265 | Tragic 34.3% |
| Immigrants | Malaysia | 0.7 /100 | #266 | Tragic 34.3% |