Italian vs Immigrants from Sri Lanka In Labor Force | Age 16-19
COMPARE
Italian
Immigrants from Sri Lanka
In Labor Force | Age 16-19
In Labor Force | Age 16-19 Comparison
Italians
Immigrants from Sri Lanka
40.1%
IN LABOR FORCE | AGE 16-19
99.9/ 100
METRIC RATING
68th/ 347
METRIC RANK
34.9%
IN LABOR FORCE | AGE 16-19
2.4/ 100
METRIC RATING
246th/ 347
METRIC RANK
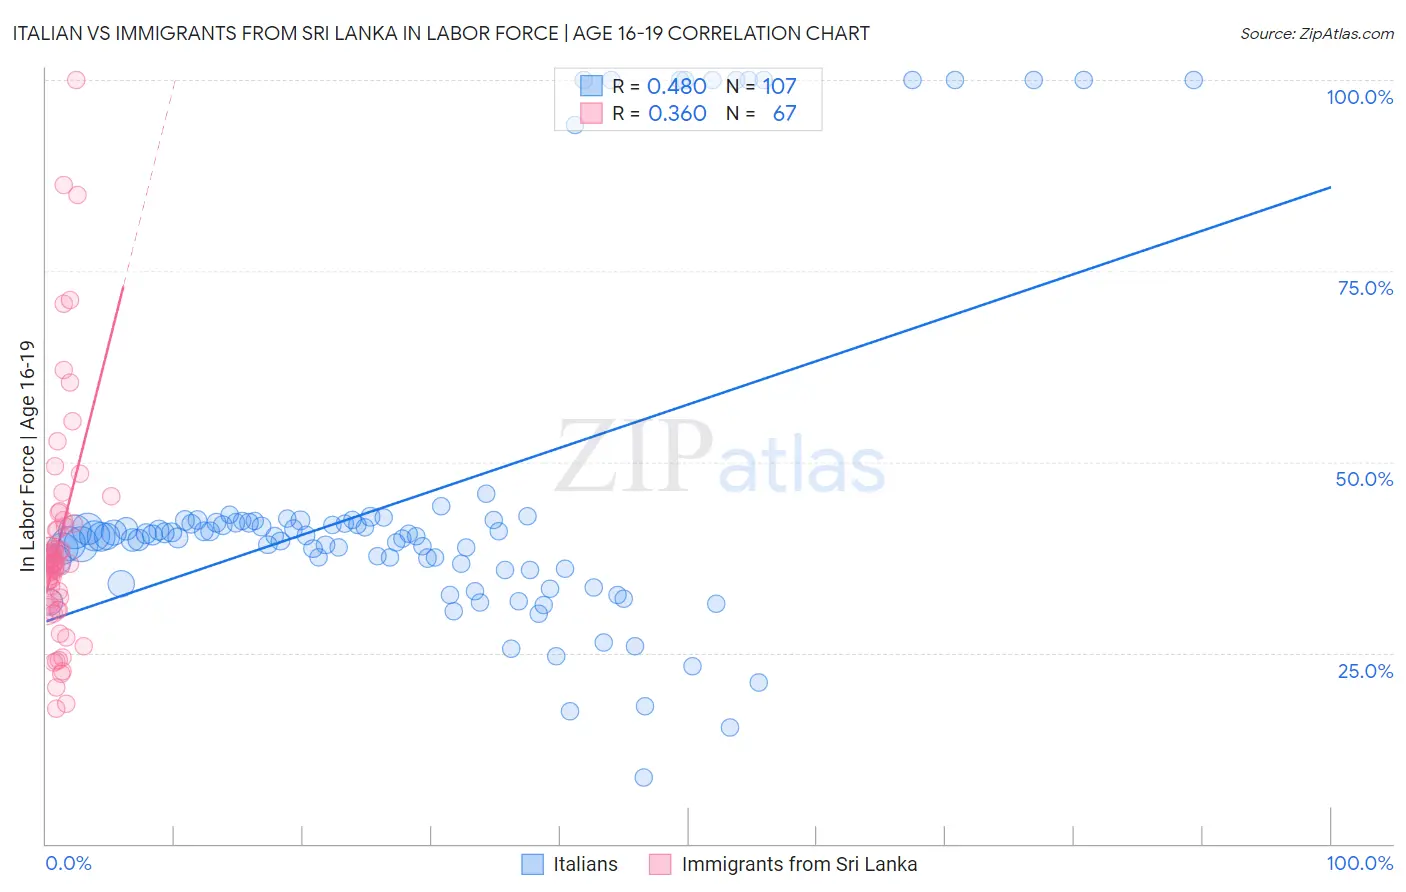
Italian vs Immigrants from Sri Lanka In Labor Force | Age 16-19 Correlation Chart
The statistical analysis conducted on geographies consisting of 570,596,297 people shows a moderate positive correlation between the proportion of Italians and labor force participation rate among population between the ages 16 and 19 in the United States with a correlation coefficient (R) of 0.480 and weighted average of 40.1%. Similarly, the statistical analysis conducted on geographies consisting of 149,654,702 people shows a mild positive correlation between the proportion of Immigrants from Sri Lanka and labor force participation rate among population between the ages 16 and 19 in the United States with a correlation coefficient (R) of 0.360 and weighted average of 34.9%, a difference of 14.9%.
In Labor Force | Age 16-19 Correlation Summary
| Measurement | Italian | Immigrants from Sri Lanka |
| Minimum | 8.6% | 17.6% |
| Maximum | 100.0% | 100.0% |
| Range | 91.4% | 82.4% |
| Mean | 45.2% | 39.5% |
| Median | 40.3% | 36.7% |
| Interquartile 25% (IQ1) | 36.1% | 31.2% |
| Interquartile 75% (IQ3) | 42.3% | 41.9% |
| Interquartile Range (IQR) | 6.2% | 10.7% |
| Standard Deviation (Sample) | 22.2% | 15.4% |
| Standard Deviation (Population) | 22.1% | 15.3% |
Similar Demographics by In Labor Force | Age 16-19
Demographics Similar to Italians by In Labor Force | Age 16-19
In terms of in labor force | age 16-19, the demographic groups most similar to Italians are Canadian (40.1%, a difference of 0.060%), Nonimmigrants (40.1%, a difference of 0.070%), Potawatomi (40.0%, a difference of 0.070%), Portuguese (40.0%, a difference of 0.12%), and Kenyan (40.1%, a difference of 0.19%).
| Demographics | Rating | Rank | In Labor Force | Age 16-19 |
| Americans | 100.0 /100 | #61 | Exceptional 40.3% |
| Cherokee | 100.0 /100 | #62 | Exceptional 40.2% |
| Northern Europeans | 100.0 /100 | #63 | Exceptional 40.2% |
| Immigrants | Micronesia | 100.0 /100 | #64 | Exceptional 40.2% |
| Kenyans | 100.0 /100 | #65 | Exceptional 40.1% |
| Immigrants | Nonimmigrants | 100.0 /100 | #66 | Exceptional 40.1% |
| Canadians | 100.0 /100 | #67 | Exceptional 40.1% |
| Italians | 99.9 /100 | #68 | Exceptional 40.1% |
| Potawatomi | 99.9 /100 | #69 | Exceptional 40.0% |
| Portuguese | 99.9 /100 | #70 | Exceptional 40.0% |
| Serbians | 99.9 /100 | #71 | Exceptional 39.9% |
| Iroquois | 99.9 /100 | #72 | Exceptional 39.9% |
| Immigrants | Middle Africa | 99.9 /100 | #73 | Exceptional 39.9% |
| Hungarians | 99.9 /100 | #74 | Exceptional 39.8% |
| French American Indians | 99.9 /100 | #75 | Exceptional 39.8% |
Demographics Similar to Immigrants from Sri Lanka by In Labor Force | Age 16-19
In terms of in labor force | age 16-19, the demographic groups most similar to Immigrants from Sri Lanka are Laotian (34.9%, a difference of 0.010%), Immigrants from Greece (34.9%, a difference of 0.020%), Immigrants from Turkey (34.9%, a difference of 0.080%), Central American (34.8%, a difference of 0.090%), and Pueblo (34.9%, a difference of 0.10%).
| Demographics | Rating | Rank | In Labor Force | Age 16-19 |
| Inupiat | 3.2 /100 | #239 | Tragic 35.0% |
| Immigrants | Central America | 3.0 /100 | #240 | Tragic 35.0% |
| Immigrants | Ireland | 2.9 /100 | #241 | Tragic 35.0% |
| Uruguayans | 2.6 /100 | #242 | Tragic 34.9% |
| Pueblo | 2.6 /100 | #243 | Tragic 34.9% |
| Immigrants | Turkey | 2.6 /100 | #244 | Tragic 34.9% |
| Immigrants | Greece | 2.4 /100 | #245 | Tragic 34.9% |
| Immigrants | Sri Lanka | 2.4 /100 | #246 | Tragic 34.9% |
| Laotians | 2.4 /100 | #247 | Tragic 34.9% |
| Central Americans | 2.2 /100 | #248 | Tragic 34.8% |
| Immigrants | Ukraine | 2.2 /100 | #249 | Tragic 34.8% |
| Immigrants | Pakistan | 2.0 /100 | #250 | Tragic 34.8% |
| Immigrants | Western Asia | 2.0 /100 | #251 | Tragic 34.8% |
| Immigrants | Chile | 2.0 /100 | #252 | Tragic 34.8% |
| Immigrants | Japan | 1.5 /100 | #253 | Tragic 34.7% |