Immigrants from Bulgaria vs Moroccan In Labor Force | Age > 16
COMPARE
Immigrants from Bulgaria
Moroccan
In Labor Force | Age > 16
In Labor Force | Age > 16 Comparison
Immigrants from Bulgaria
Moroccans
66.6%
IN LABOR FORCE | AGE > 16
100.0/ 100
METRIC RATING
47th/ 347
METRIC RANK
66.1%
IN LABOR FORCE | AGE > 16
99.5/ 100
METRIC RATING
81st/ 347
METRIC RANK
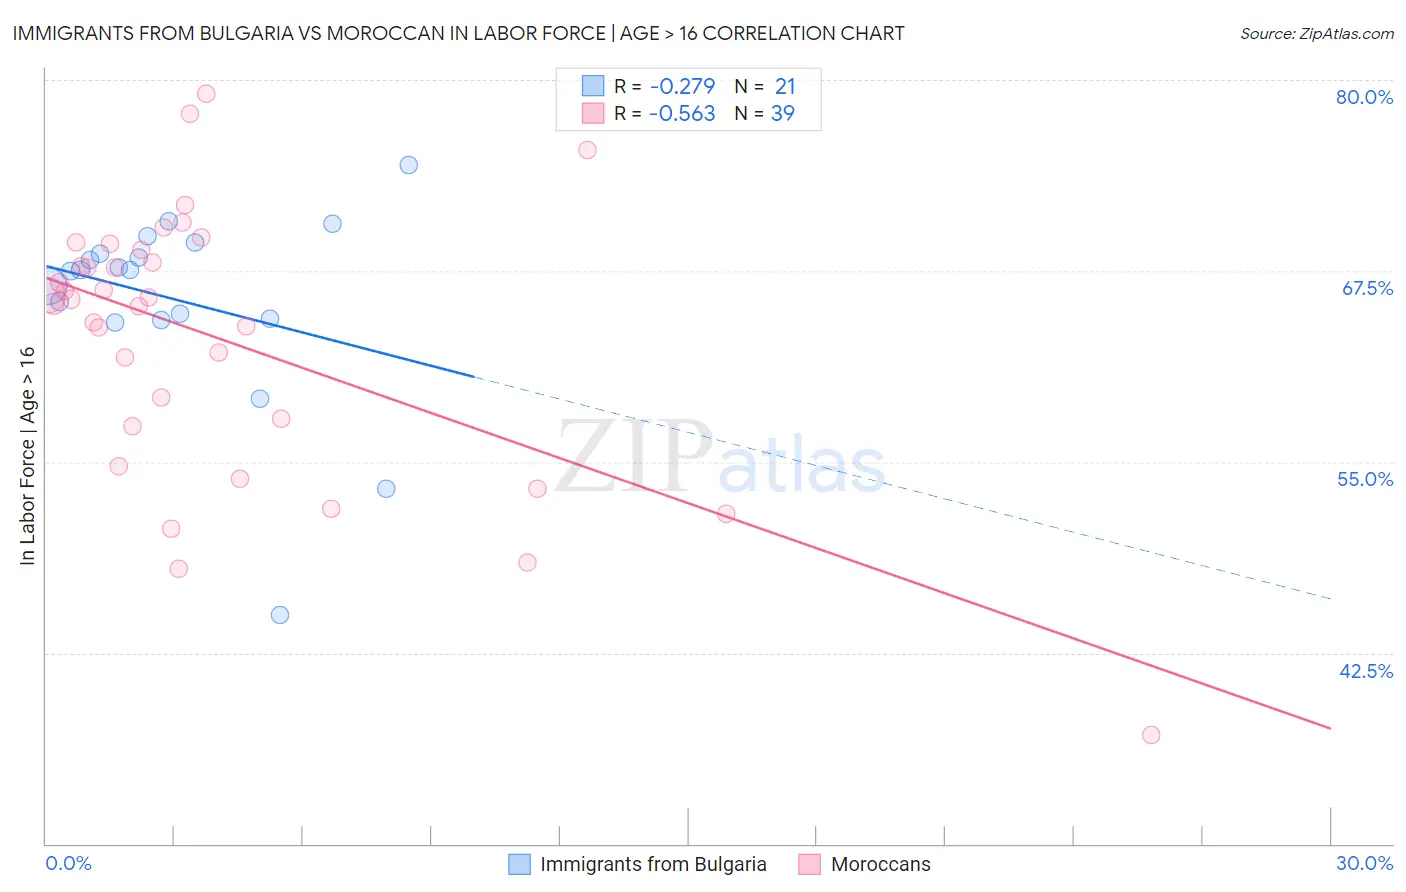
Immigrants from Bulgaria vs Moroccan In Labor Force | Age > 16 Correlation Chart
The statistical analysis conducted on geographies consisting of 172,552,113 people shows a weak negative correlation between the proportion of Immigrants from Bulgaria and labor force participation rate among population ages 16 and over in the United States with a correlation coefficient (R) of -0.279 and weighted average of 66.6%. Similarly, the statistical analysis conducted on geographies consisting of 201,807,372 people shows a substantial negative correlation between the proportion of Moroccans and labor force participation rate among population ages 16 and over in the United States with a correlation coefficient (R) of -0.563 and weighted average of 66.1%, a difference of 0.82%.
In Labor Force | Age > 16 Correlation Summary
| Measurement | Immigrants from Bulgaria | Moroccan |
| Minimum | 45.0% | 37.1% |
| Maximum | 74.4% | 79.1% |
| Range | 29.4% | 42.0% |
| Mean | 65.6% | 63.1% |
| Median | 67.5% | 65.7% |
| Interquartile 25% (IQ1) | 64.3% | 57.4% |
| Interquartile 75% (IQ3) | 69.0% | 68.9% |
| Interquartile Range (IQR) | 4.7% | 11.5% |
| Standard Deviation (Sample) | 6.4% | 8.9% |
| Standard Deviation (Population) | 6.3% | 8.7% |
Similar Demographics by In Labor Force | Age > 16
Demographics Similar to Immigrants from Bulgaria by In Labor Force | Age > 16
In terms of in labor force | age > 16, the demographic groups most similar to Immigrants from Bulgaria are Brazilian (66.6%, a difference of 0.0%), Nigerian (66.6%, a difference of 0.010%), Immigrants from Northern Africa (66.6%, a difference of 0.030%), Immigrants from Brazil (66.7%, a difference of 0.070%), and Cape Verdean (66.6%, a difference of 0.080%).
| Demographics | Rating | Rank | In Labor Force | Age > 16 |
| Immigrants | El Salvador | 100.0 /100 | #40 | Exceptional 66.8% |
| Immigrants | Zimbabwe | 100.0 /100 | #41 | Exceptional 66.8% |
| Senegalese | 100.0 /100 | #42 | Exceptional 66.7% |
| Luxembourgers | 100.0 /100 | #43 | Exceptional 66.7% |
| Immigrants | Pakistan | 100.0 /100 | #44 | Exceptional 66.7% |
| Immigrants | Brazil | 100.0 /100 | #45 | Exceptional 66.7% |
| Brazilians | 100.0 /100 | #46 | Exceptional 66.6% |
| Immigrants | Bulgaria | 100.0 /100 | #47 | Exceptional 66.6% |
| Nigerians | 100.0 /100 | #48 | Exceptional 66.6% |
| Immigrants | Northern Africa | 100.0 /100 | #49 | Exceptional 66.6% |
| Cape Verdeans | 100.0 /100 | #50 | Exceptional 66.6% |
| Immigrants | Kuwait | 100.0 /100 | #51 | Exceptional 66.5% |
| Paraguayans | 99.9 /100 | #52 | Exceptional 66.5% |
| Immigrants | Sri Lanka | 99.9 /100 | #53 | Exceptional 66.5% |
| Immigrants | Bosnia and Herzegovina | 99.9 /100 | #54 | Exceptional 66.5% |
Demographics Similar to Moroccans by In Labor Force | Age > 16
In terms of in labor force | age > 16, the demographic groups most similar to Moroccans are German Russian (66.1%, a difference of 0.010%), Immigrants from Jordan (66.1%, a difference of 0.010%), Central American (66.1%, a difference of 0.020%), Mongolian (66.1%, a difference of 0.030%), and Malaysian (66.1%, a difference of 0.050%).
| Demographics | Rating | Rank | In Labor Force | Age > 16 |
| Immigrants | Korea | 99.7 /100 | #74 | Exceptional 66.2% |
| Immigrants | Singapore | 99.7 /100 | #75 | Exceptional 66.2% |
| Immigrants | Malaysia | 99.6 /100 | #76 | Exceptional 66.1% |
| Immigrants | Moldova | 99.6 /100 | #77 | Exceptional 66.1% |
| Immigrants | Asia | 99.6 /100 | #78 | Exceptional 66.1% |
| Turks | 99.6 /100 | #79 | Exceptional 66.1% |
| Malaysians | 99.6 /100 | #80 | Exceptional 66.1% |
| Moroccans | 99.5 /100 | #81 | Exceptional 66.1% |
| German Russians | 99.4 /100 | #82 | Exceptional 66.1% |
| Immigrants | Jordan | 99.4 /100 | #83 | Exceptional 66.1% |
| Central Americans | 99.4 /100 | #84 | Exceptional 66.1% |
| Mongolians | 99.4 /100 | #85 | Exceptional 66.1% |
| South Americans | 99.4 /100 | #86 | Exceptional 66.0% |
| South American Indians | 99.4 /100 | #87 | Exceptional 66.0% |
| Bermudans | 99.3 /100 | #88 | Exceptional 66.0% |