Soviet Union vs Moroccan In Labor Force | Age > 16
COMPARE
Soviet Union
Moroccan
In Labor Force | Age > 16
In Labor Force | Age > 16 Comparison
Soviet Union
Moroccans
65.0%
IN LABOR FORCE | AGE > 16
40.5/ 100
METRIC RATING
183rd/ 347
METRIC RANK
66.1%
IN LABOR FORCE | AGE > 16
99.5/ 100
METRIC RATING
81st/ 347
METRIC RANK
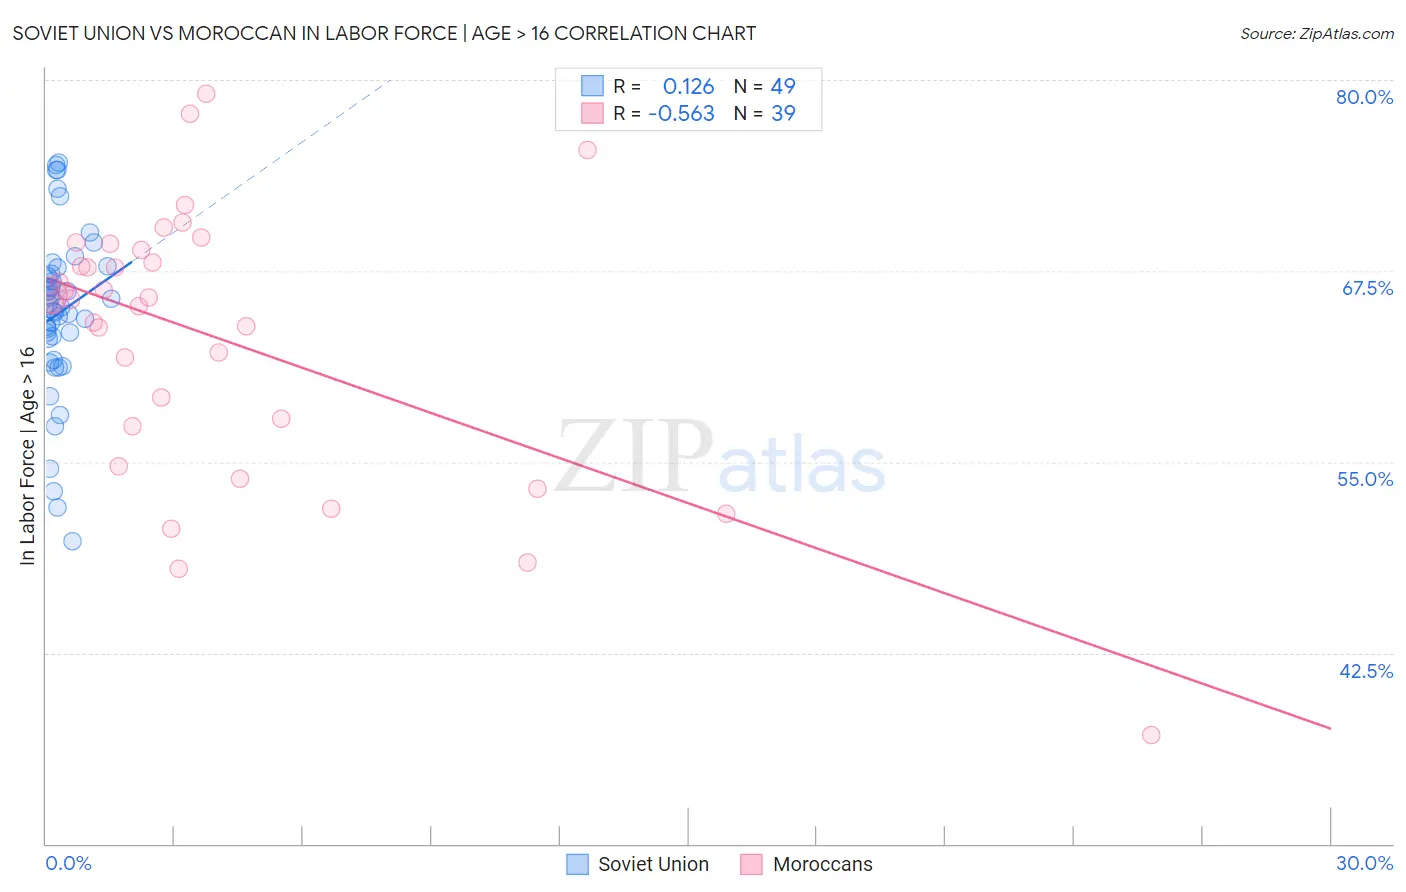
Soviet Union vs Moroccan In Labor Force | Age > 16 Correlation Chart
The statistical analysis conducted on geographies consisting of 43,504,651 people shows a poor positive correlation between the proportion of Soviet Union and labor force participation rate among population ages 16 and over in the United States with a correlation coefficient (R) of 0.126 and weighted average of 65.0%. Similarly, the statistical analysis conducted on geographies consisting of 201,807,372 people shows a substantial negative correlation between the proportion of Moroccans and labor force participation rate among population ages 16 and over in the United States with a correlation coefficient (R) of -0.563 and weighted average of 66.1%, a difference of 1.6%.
In Labor Force | Age > 16 Correlation Summary
| Measurement | Soviet Union | Moroccan |
| Minimum | 49.8% | 37.1% |
| Maximum | 74.6% | 79.1% |
| Range | 24.8% | 42.0% |
| Mean | 64.8% | 63.1% |
| Median | 65.1% | 65.7% |
| Interquartile 25% (IQ1) | 62.4% | 57.4% |
| Interquartile 75% (IQ3) | 67.5% | 68.9% |
| Interquartile Range (IQR) | 5.1% | 11.5% |
| Standard Deviation (Sample) | 5.5% | 8.9% |
| Standard Deviation (Population) | 5.4% | 8.7% |
Similar Demographics by In Labor Force | Age > 16
Demographics Similar to Soviet Union by In Labor Force | Age > 16
In terms of in labor force | age > 16, the demographic groups most similar to Soviet Union are Immigrants from Nicaragua (65.1%, a difference of 0.010%), Carpatho Rusyn (65.0%, a difference of 0.010%), Syrian (65.0%, a difference of 0.010%), Immigrants from Panama (65.1%, a difference of 0.020%), and Immigrants from Haiti (65.1%, a difference of 0.030%).
| Demographics | Rating | Rank | In Labor Force | Age > 16 |
| Swedes | 47.4 /100 | #176 | Average 65.1% |
| Eastern Europeans | 46.2 /100 | #177 | Average 65.1% |
| Trinidadians and Tobagonians | 45.2 /100 | #178 | Average 65.1% |
| Immigrants | Haiti | 43.3 /100 | #179 | Average 65.1% |
| Immigrants | Latvia | 42.9 /100 | #180 | Average 65.1% |
| Immigrants | Panama | 42.4 /100 | #181 | Average 65.1% |
| Immigrants | Nicaragua | 41.1 /100 | #182 | Average 65.1% |
| Soviet Union | 40.5 /100 | #183 | Average 65.0% |
| Carpatho Rusyns | 40.0 /100 | #184 | Average 65.0% |
| Syrians | 40.0 /100 | #185 | Average 65.0% |
| Immigrants | Switzerland | 38.2 /100 | #186 | Fair 65.0% |
| Immigrants | Croatia | 35.7 /100 | #187 | Fair 65.0% |
| Immigrants | Portugal | 34.8 /100 | #188 | Fair 65.0% |
| Immigrants | Greece | 34.3 /100 | #189 | Fair 65.0% |
| Barbadians | 33.9 /100 | #190 | Fair 65.0% |
Demographics Similar to Moroccans by In Labor Force | Age > 16
In terms of in labor force | age > 16, the demographic groups most similar to Moroccans are German Russian (66.1%, a difference of 0.010%), Immigrants from Jordan (66.1%, a difference of 0.010%), Central American (66.1%, a difference of 0.020%), Mongolian (66.1%, a difference of 0.030%), and Malaysian (66.1%, a difference of 0.050%).
| Demographics | Rating | Rank | In Labor Force | Age > 16 |
| Immigrants | Korea | 99.7 /100 | #74 | Exceptional 66.2% |
| Immigrants | Singapore | 99.7 /100 | #75 | Exceptional 66.2% |
| Immigrants | Malaysia | 99.6 /100 | #76 | Exceptional 66.1% |
| Immigrants | Moldova | 99.6 /100 | #77 | Exceptional 66.1% |
| Immigrants | Asia | 99.6 /100 | #78 | Exceptional 66.1% |
| Turks | 99.6 /100 | #79 | Exceptional 66.1% |
| Malaysians | 99.6 /100 | #80 | Exceptional 66.1% |
| Moroccans | 99.5 /100 | #81 | Exceptional 66.1% |
| German Russians | 99.4 /100 | #82 | Exceptional 66.1% |
| Immigrants | Jordan | 99.4 /100 | #83 | Exceptional 66.1% |
| Central Americans | 99.4 /100 | #84 | Exceptional 66.1% |
| Mongolians | 99.4 /100 | #85 | Exceptional 66.1% |
| South Americans | 99.4 /100 | #86 | Exceptional 66.0% |
| South American Indians | 99.4 /100 | #87 | Exceptional 66.0% |
| Bermudans | 99.3 /100 | #88 | Exceptional 66.0% |