Korean vs Immigrants from Western Europe In Labor Force | Age 20-24
COMPARE
Korean
Immigrants from Western Europe
In Labor Force | Age 20-24
In Labor Force | Age 20-24 Comparison
Koreans
Immigrants from Western Europe
75.4%
IN LABOR FORCE | AGE 20-24
79.7/ 100
METRIC RATING
145th/ 347
METRIC RANK
75.3%
IN LABOR FORCE | AGE 20-24
71.5/ 100
METRIC RATING
157th/ 347
METRIC RANK
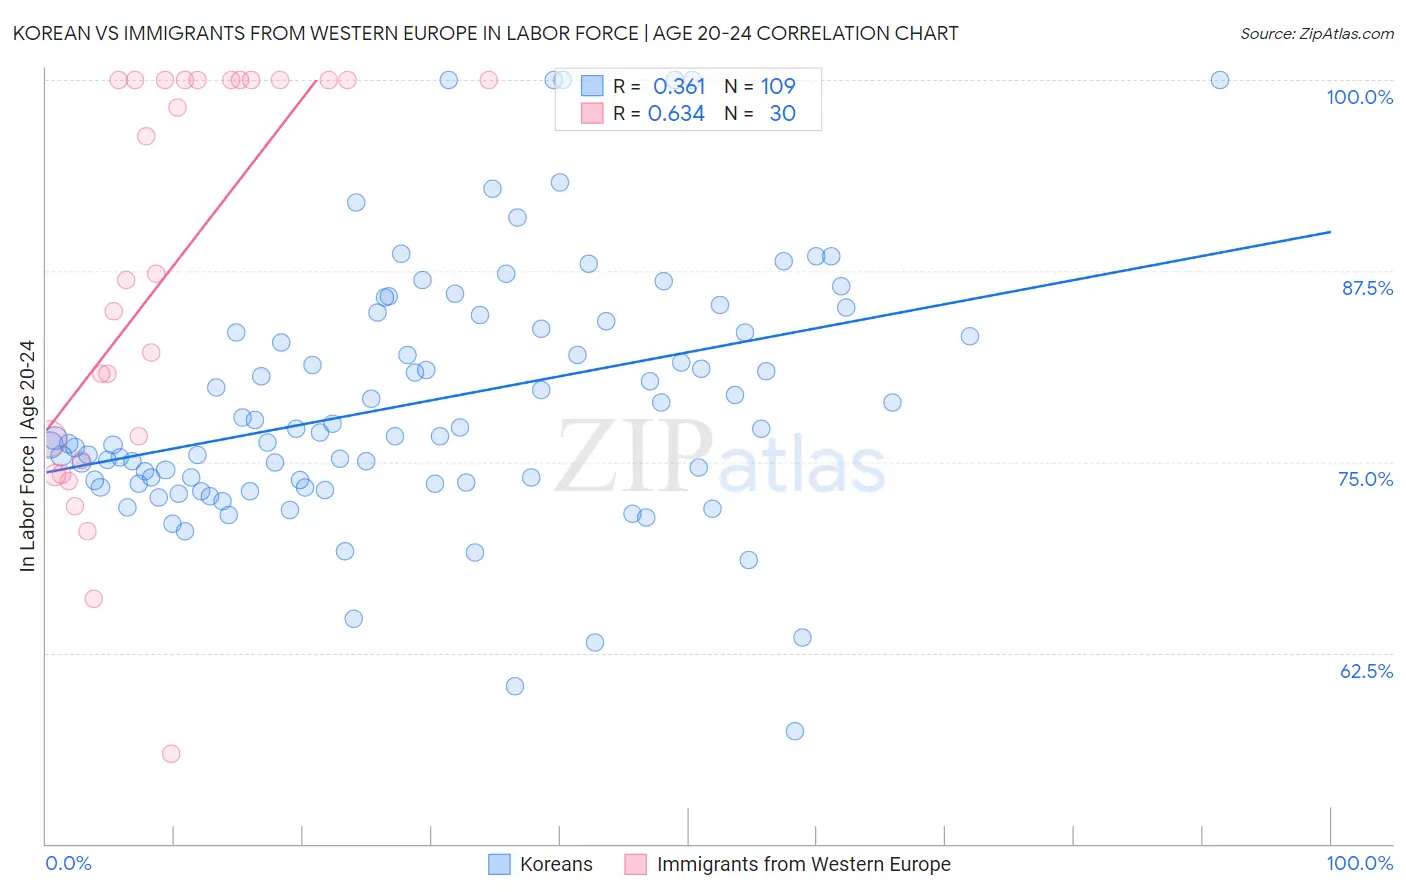
Korean vs Immigrants from Western Europe In Labor Force | Age 20-24 Correlation Chart
The statistical analysis conducted on geographies consisting of 510,540,688 people shows a mild positive correlation between the proportion of Koreans and labor force participation rate among population between the ages 20 and 24 in the United States with a correlation coefficient (R) of 0.361 and weighted average of 75.4%. Similarly, the statistical analysis conducted on geographies consisting of 493,597,836 people shows a significant positive correlation between the proportion of Immigrants from Western Europe and labor force participation rate among population between the ages 20 and 24 in the United States with a correlation coefficient (R) of 0.634 and weighted average of 75.3%, a difference of 0.16%.
In Labor Force | Age 20-24 Correlation Summary
| Measurement | Korean | Immigrants from Western Europe |
| Minimum | 57.4% | 55.9% |
| Maximum | 100.0% | 100.0% |
| Range | 42.6% | 44.1% |
| Mean | 79.0% | 87.1% |
| Median | 76.9% | 87.1% |
| Interquartile 25% (IQ1) | 73.6% | 75.1% |
| Interquartile 75% (IQ3) | 84.0% | 100.0% |
| Interquartile Range (IQR) | 10.3% | 24.9% |
| Standard Deviation (Sample) | 8.4% | 13.3% |
| Standard Deviation (Population) | 8.3% | 13.1% |
Demographics Similar to Koreans and Immigrants from Western Europe by In Labor Force | Age 20-24
In terms of in labor force | age 20-24, the demographic groups most similar to Koreans are Mexican American Indian (75.4%, a difference of 0.020%), Bhutanese (75.4%, a difference of 0.030%), Spaniard (75.5%, a difference of 0.050%), Comanche (75.4%, a difference of 0.050%), and Immigrants from Cambodia (75.4%, a difference of 0.060%). Similarly, the demographic groups most similar to Immigrants from Western Europe are Immigrants from El Salvador (75.3%, a difference of 0.0%), Guatemalan (75.3%, a difference of 0.010%), Osage (75.3%, a difference of 0.010%), Immigrants from Guatemala (75.3%, a difference of 0.010%), and Immigrants from Bolivia (75.3%, a difference of 0.010%).
| Demographics | Rating | Rank | In Labor Force | Age 20-24 |
| Romanians | 84.1 /100 | #141 | Excellent 75.5% |
| Blackfeet | 83.6 /100 | #142 | Excellent 75.5% |
| Spaniards | 82.0 /100 | #143 | Excellent 75.5% |
| Bhutanese | 80.8 /100 | #144 | Excellent 75.4% |
| Koreans | 79.7 /100 | #145 | Good 75.4% |
| Mexican American Indians | 78.8 /100 | #146 | Good 75.4% |
| Comanche | 77.6 /100 | #147 | Good 75.4% |
| Immigrants | Cambodia | 76.7 /100 | #148 | Good 75.4% |
| Ugandans | 76.1 /100 | #149 | Good 75.4% |
| Salvadorans | 74.8 /100 | #150 | Good 75.3% |
| Paiute | 74.1 /100 | #151 | Good 75.3% |
| Lebanese | 73.5 /100 | #152 | Good 75.3% |
| Guatemalans | 72.3 /100 | #153 | Good 75.3% |
| Osage | 72.3 /100 | #154 | Good 75.3% |
| Immigrants | Guatemala | 71.9 /100 | #155 | Good 75.3% |
| Immigrants | El Salvador | 71.7 /100 | #156 | Good 75.3% |
| Immigrants | Western Europe | 71.5 /100 | #157 | Good 75.3% |
| Immigrants | Bolivia | 71.0 /100 | #158 | Good 75.3% |
| South American Indians | 69.0 /100 | #159 | Good 75.3% |
| Japanese | 68.7 /100 | #160 | Good 75.3% |
| New Zealanders | 65.4 /100 | #161 | Good 75.2% |