Korean vs Scandinavian In Labor Force | Age 20-24
COMPARE
Korean
Scandinavian
In Labor Force | Age 20-24
In Labor Force | Age 20-24 Comparison
Koreans
Scandinavians
75.4%
IN LABOR FORCE | AGE 20-24
79.7/ 100
METRIC RATING
145th/ 347
METRIC RANK
78.5%
IN LABOR FORCE | AGE 20-24
100.0/ 100
METRIC RATING
13th/ 347
METRIC RANK
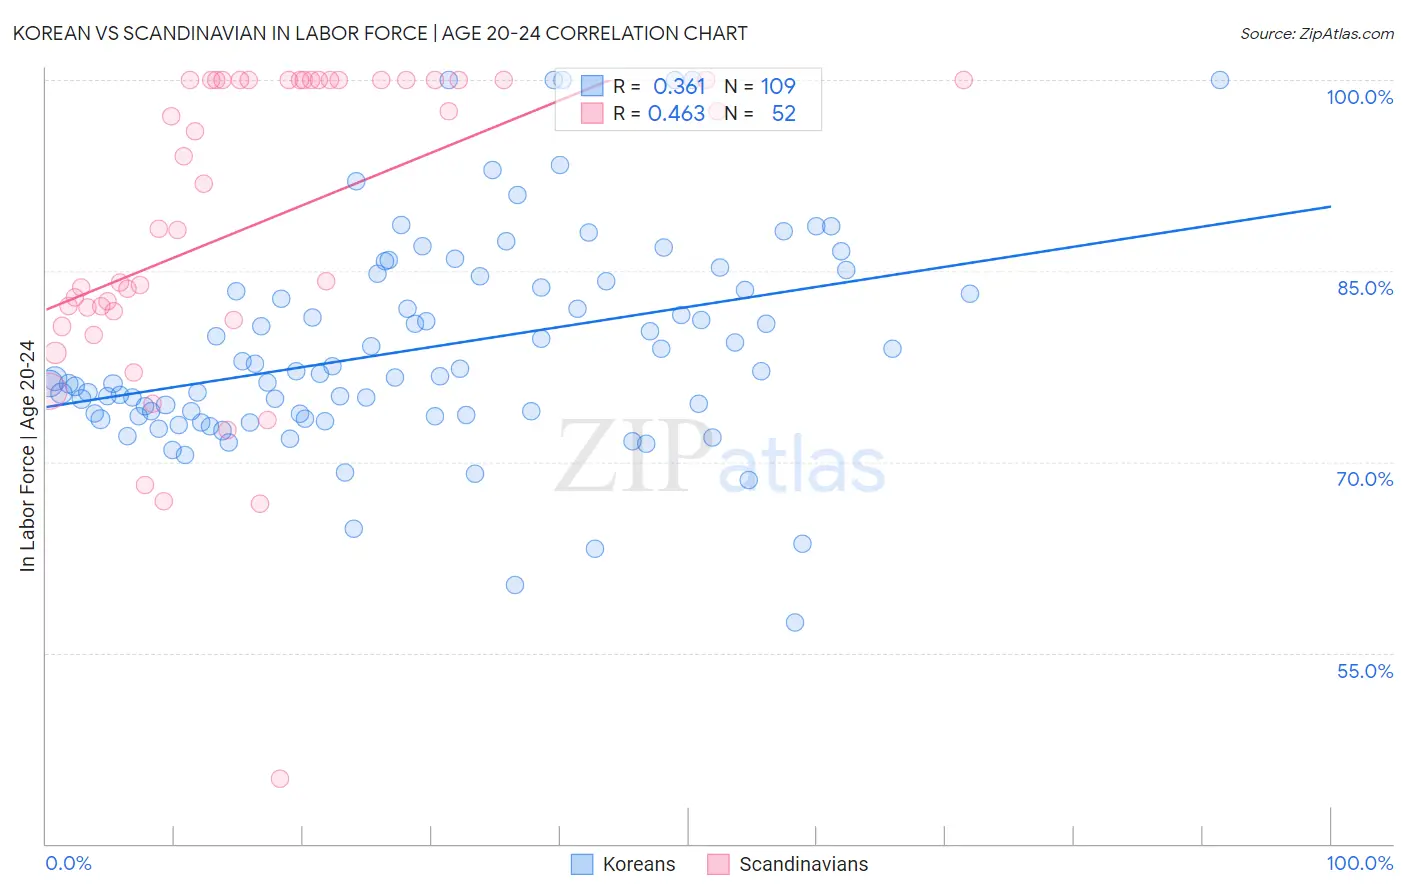
Korean vs Scandinavian In Labor Force | Age 20-24 Correlation Chart
The statistical analysis conducted on geographies consisting of 510,540,688 people shows a mild positive correlation between the proportion of Koreans and labor force participation rate among population between the ages 20 and 24 in the United States with a correlation coefficient (R) of 0.361 and weighted average of 75.4%. Similarly, the statistical analysis conducted on geographies consisting of 472,144,602 people shows a moderate positive correlation between the proportion of Scandinavians and labor force participation rate among population between the ages 20 and 24 in the United States with a correlation coefficient (R) of 0.463 and weighted average of 78.5%, a difference of 4.1%.
In Labor Force | Age 20-24 Correlation Summary
| Measurement | Korean | Scandinavian |
| Minimum | 57.4% | 45.1% |
| Maximum | 100.0% | 100.0% |
| Range | 42.6% | 54.9% |
| Mean | 79.0% | 88.5% |
| Median | 76.9% | 90.1% |
| Interquartile 25% (IQ1) | 73.6% | 81.5% |
| Interquartile 75% (IQ3) | 84.0% | 100.0% |
| Interquartile Range (IQR) | 10.3% | 18.5% |
| Standard Deviation (Sample) | 8.4% | 12.4% |
| Standard Deviation (Population) | 8.3% | 12.3% |
Similar Demographics by In Labor Force | Age 20-24
Demographics Similar to Koreans by In Labor Force | Age 20-24
In terms of in labor force | age 20-24, the demographic groups most similar to Koreans are Mexican American Indian (75.4%, a difference of 0.020%), Bhutanese (75.4%, a difference of 0.030%), Spaniard (75.5%, a difference of 0.050%), Comanche (75.4%, a difference of 0.050%), and Immigrants from Cambodia (75.4%, a difference of 0.060%).
| Demographics | Rating | Rank | In Labor Force | Age 20-24 |
| Australians | 84.8 /100 | #138 | Excellent 75.5% |
| Immigrants | England | 84.6 /100 | #139 | Excellent 75.5% |
| Delaware | 84.5 /100 | #140 | Excellent 75.5% |
| Romanians | 84.1 /100 | #141 | Excellent 75.5% |
| Blackfeet | 83.6 /100 | #142 | Excellent 75.5% |
| Spaniards | 82.0 /100 | #143 | Excellent 75.5% |
| Bhutanese | 80.8 /100 | #144 | Excellent 75.4% |
| Koreans | 79.7 /100 | #145 | Good 75.4% |
| Mexican American Indians | 78.8 /100 | #146 | Good 75.4% |
| Comanche | 77.6 /100 | #147 | Good 75.4% |
| Immigrants | Cambodia | 76.7 /100 | #148 | Good 75.4% |
| Ugandans | 76.1 /100 | #149 | Good 75.4% |
| Salvadorans | 74.8 /100 | #150 | Good 75.3% |
| Paiute | 74.1 /100 | #151 | Good 75.3% |
| Lebanese | 73.5 /100 | #152 | Good 75.3% |
Demographics Similar to Scandinavians by In Labor Force | Age 20-24
In terms of in labor force | age 20-24, the demographic groups most similar to Scandinavians are Czech (78.5%, a difference of 0.010%), German (78.6%, a difference of 0.070%), Sudanese (78.4%, a difference of 0.14%), Finnish (78.7%, a difference of 0.18%), and Dutch (78.4%, a difference of 0.19%).
| Demographics | Rating | Rank | In Labor Force | Age 20-24 |
| Danes | 100.0 /100 | #6 | Exceptional 79.0% |
| Luxembourgers | 100.0 /100 | #7 | Exceptional 79.0% |
| Immigrants | Cabo Verde | 100.0 /100 | #8 | Exceptional 78.9% |
| Swedes | 100.0 /100 | #9 | Exceptional 78.8% |
| Slovenes | 100.0 /100 | #10 | Exceptional 78.7% |
| Finns | 100.0 /100 | #11 | Exceptional 78.7% |
| Germans | 100.0 /100 | #12 | Exceptional 78.6% |
| Scandinavians | 100.0 /100 | #13 | Exceptional 78.5% |
| Czechs | 100.0 /100 | #14 | Exceptional 78.5% |
| Sudanese | 100.0 /100 | #15 | Exceptional 78.4% |
| Dutch | 100.0 /100 | #16 | Exceptional 78.4% |
| Cape Verdeans | 100.0 /100 | #17 | Exceptional 78.3% |
| Immigrants | Bosnia and Herzegovina | 100.0 /100 | #18 | Exceptional 78.1% |
| Bangladeshis | 100.0 /100 | #19 | Exceptional 78.1% |
| French Canadians | 100.0 /100 | #20 | Exceptional 78.1% |