Central American Indian vs Ugandan In Labor Force | Age 20-24
COMPARE
Central American Indian
Ugandan
In Labor Force | Age 20-24
In Labor Force | Age 20-24 Comparison
Central American Indians
Ugandans
72.7%
IN LABOR FORCE | AGE 20-24
0.0/ 100
METRIC RATING
297th/ 347
METRIC RANK
75.4%
IN LABOR FORCE | AGE 20-24
76.1/ 100
METRIC RATING
149th/ 347
METRIC RANK
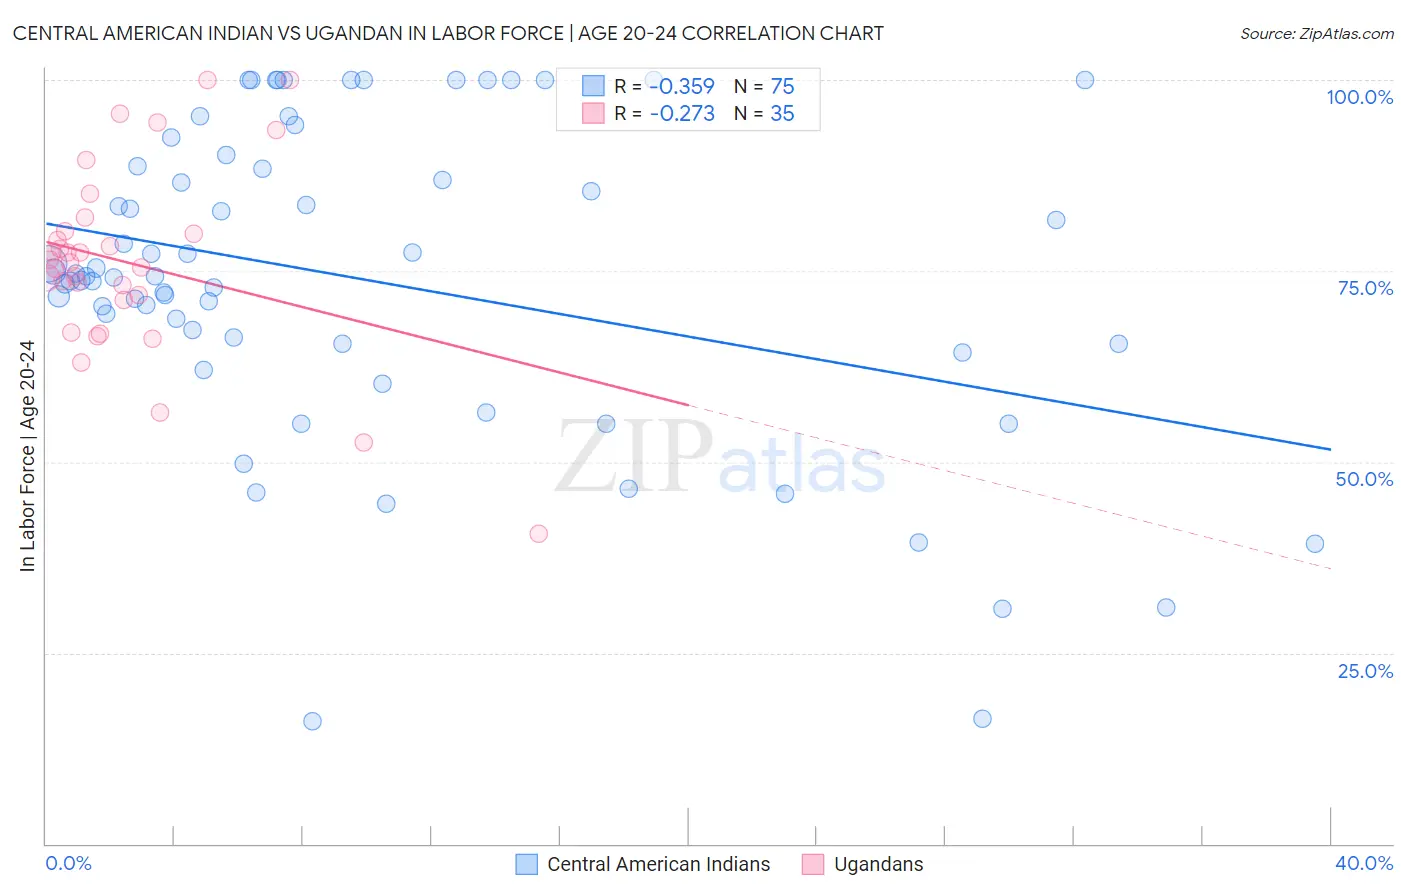
Central American Indian vs Ugandan In Labor Force | Age 20-24 Correlation Chart
The statistical analysis conducted on geographies consisting of 326,106,765 people shows a mild negative correlation between the proportion of Central American Indians and labor force participation rate among population between the ages 20 and 24 in the United States with a correlation coefficient (R) of -0.359 and weighted average of 72.7%. Similarly, the statistical analysis conducted on geographies consisting of 94,014,885 people shows a weak negative correlation between the proportion of Ugandans and labor force participation rate among population between the ages 20 and 24 in the United States with a correlation coefficient (R) of -0.273 and weighted average of 75.4%, a difference of 3.7%.
In Labor Force | Age 20-24 Correlation Summary
| Measurement | Central American Indian | Ugandan |
| Minimum | 16.0% | 40.6% |
| Maximum | 100.0% | 100.0% |
| Range | 84.0% | 59.4% |
| Mean | 73.8% | 76.1% |
| Median | 74.3% | 76.0% |
| Interquartile 25% (IQ1) | 65.5% | 71.2% |
| Interquartile 75% (IQ3) | 88.7% | 80.2% |
| Interquartile Range (IQR) | 23.2% | 8.9% |
| Standard Deviation (Sample) | 20.4% | 12.5% |
| Standard Deviation (Population) | 20.3% | 12.3% |
Similar Demographics by In Labor Force | Age 20-24
Demographics Similar to Central American Indians by In Labor Force | Age 20-24
In terms of in labor force | age 20-24, the demographic groups most similar to Central American Indians are Okinawan (72.7%, a difference of 0.050%), Jamaican (72.7%, a difference of 0.050%), Israeli (72.6%, a difference of 0.13%), Immigrants from Argentina (72.8%, a difference of 0.16%), and Iranian (72.6%, a difference of 0.17%).
| Demographics | Rating | Rank | In Labor Force | Age 20-24 |
| Immigrants | Belarus | 0.1 /100 | #290 | Tragic 73.0% |
| Immigrants | Nicaragua | 0.0 /100 | #291 | Tragic 72.9% |
| Pueblo | 0.0 /100 | #292 | Tragic 72.9% |
| Immigrants | Belize | 0.0 /100 | #293 | Tragic 72.8% |
| Immigrants | Argentina | 0.0 /100 | #294 | Tragic 72.8% |
| Okinawans | 0.0 /100 | #295 | Tragic 72.7% |
| Jamaicans | 0.0 /100 | #296 | Tragic 72.7% |
| Central American Indians | 0.0 /100 | #297 | Tragic 72.7% |
| Israelis | 0.0 /100 | #298 | Tragic 72.6% |
| Iranians | 0.0 /100 | #299 | Tragic 72.6% |
| Armenians | 0.0 /100 | #300 | Tragic 72.5% |
| Cubans | 0.0 /100 | #301 | Tragic 72.5% |
| Natives/Alaskans | 0.0 /100 | #302 | Tragic 72.4% |
| Ecuadorians | 0.0 /100 | #303 | Tragic 72.4% |
| Immigrants | West Indies | 0.0 /100 | #304 | Tragic 72.4% |
Demographics Similar to Ugandans by In Labor Force | Age 20-24
In terms of in labor force | age 20-24, the demographic groups most similar to Ugandans are Immigrants from Cambodia (75.4%, a difference of 0.010%), Salvadoran (75.3%, a difference of 0.020%), Comanche (75.4%, a difference of 0.030%), Paiute (75.3%, a difference of 0.040%), and Lebanese (75.3%, a difference of 0.050%).
| Demographics | Rating | Rank | In Labor Force | Age 20-24 |
| Blackfeet | 83.6 /100 | #142 | Excellent 75.5% |
| Spaniards | 82.0 /100 | #143 | Excellent 75.5% |
| Bhutanese | 80.8 /100 | #144 | Excellent 75.4% |
| Koreans | 79.7 /100 | #145 | Good 75.4% |
| Mexican American Indians | 78.8 /100 | #146 | Good 75.4% |
| Comanche | 77.6 /100 | #147 | Good 75.4% |
| Immigrants | Cambodia | 76.7 /100 | #148 | Good 75.4% |
| Ugandans | 76.1 /100 | #149 | Good 75.4% |
| Salvadorans | 74.8 /100 | #150 | Good 75.3% |
| Paiute | 74.1 /100 | #151 | Good 75.3% |
| Lebanese | 73.5 /100 | #152 | Good 75.3% |
| Guatemalans | 72.3 /100 | #153 | Good 75.3% |
| Osage | 72.3 /100 | #154 | Good 75.3% |
| Immigrants | Guatemala | 71.9 /100 | #155 | Good 75.3% |
| Immigrants | El Salvador | 71.7 /100 | #156 | Good 75.3% |