Immigrants from Armenia vs Ugandan In Labor Force | Age 20-24
COMPARE
Immigrants from Armenia
Ugandan
In Labor Force | Age 20-24
In Labor Force | Age 20-24 Comparison
Immigrants from Armenia
Ugandans
71.7%
IN LABOR FORCE | AGE 20-24
0.0/ 100
METRIC RATING
317th/ 347
METRIC RANK
75.4%
IN LABOR FORCE | AGE 20-24
76.1/ 100
METRIC RATING
149th/ 347
METRIC RANK
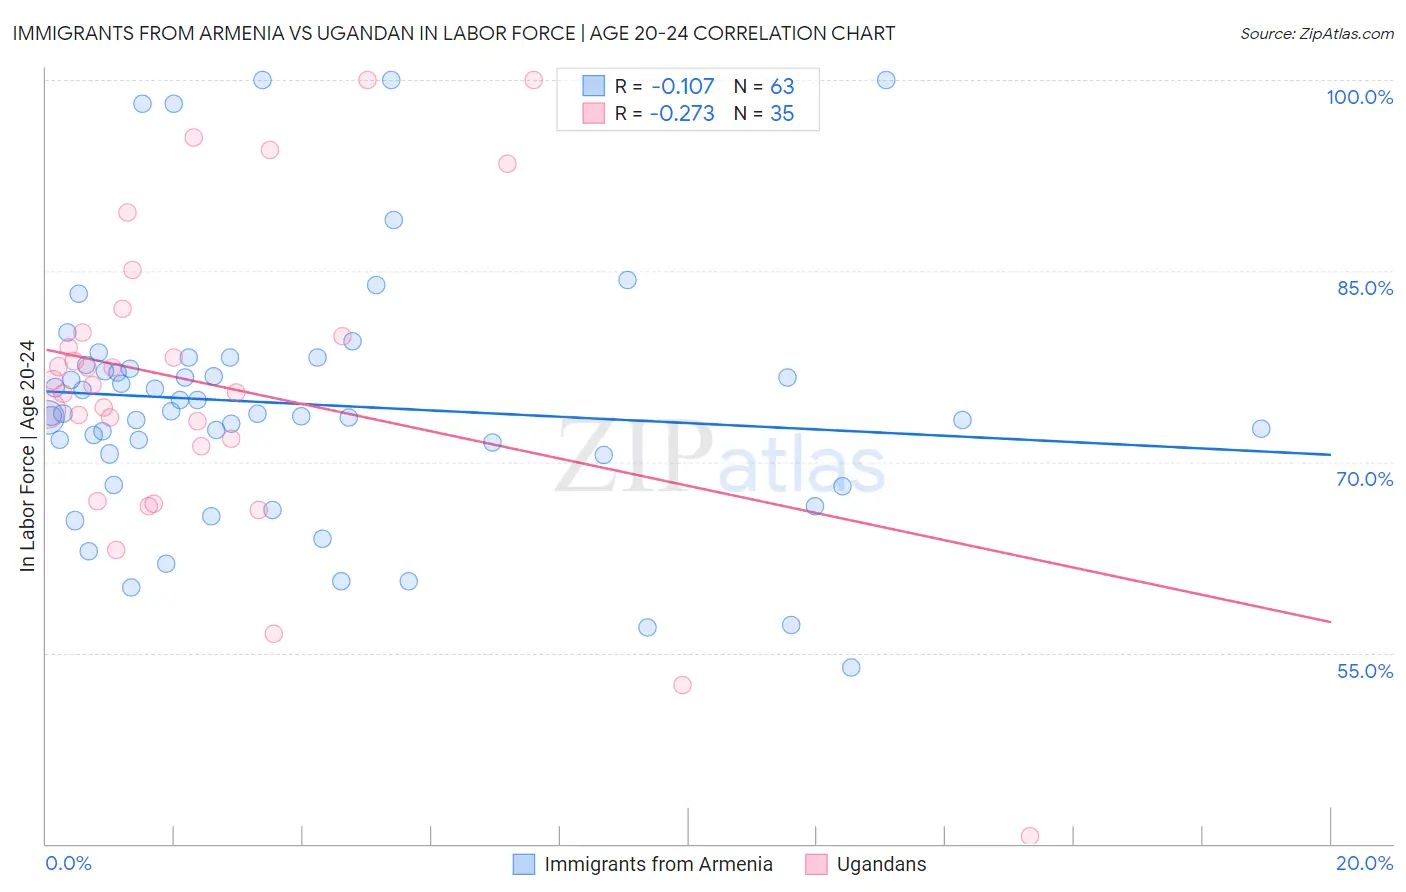
Immigrants from Armenia vs Ugandan In Labor Force | Age 20-24 Correlation Chart
The statistical analysis conducted on geographies consisting of 97,714,117 people shows a poor negative correlation between the proportion of Immigrants from Armenia and labor force participation rate among population between the ages 20 and 24 in the United States with a correlation coefficient (R) of -0.107 and weighted average of 71.7%. Similarly, the statistical analysis conducted on geographies consisting of 94,014,885 people shows a weak negative correlation between the proportion of Ugandans and labor force participation rate among population between the ages 20 and 24 in the United States with a correlation coefficient (R) of -0.273 and weighted average of 75.4%, a difference of 5.2%.
In Labor Force | Age 20-24 Correlation Summary
| Measurement | Immigrants from Armenia | Ugandan |
| Minimum | 53.8% | 40.6% |
| Maximum | 100.0% | 100.0% |
| Range | 46.2% | 59.4% |
| Mean | 74.6% | 76.1% |
| Median | 73.8% | 76.0% |
| Interquartile 25% (IQ1) | 70.5% | 71.2% |
| Interquartile 75% (IQ3) | 77.6% | 80.2% |
| Interquartile Range (IQR) | 7.1% | 8.9% |
| Standard Deviation (Sample) | 10.0% | 12.5% |
| Standard Deviation (Population) | 9.9% | 12.3% |
Similar Demographics by In Labor Force | Age 20-24
Demographics Similar to Immigrants from Armenia by In Labor Force | Age 20-24
In terms of in labor force | age 20-24, the demographic groups most similar to Immigrants from Armenia are Immigrants from Hong Kong (71.6%, a difference of 0.090%), Immigrants from Israel (71.6%, a difference of 0.12%), Immigrants from Eastern Asia (71.8%, a difference of 0.17%), Trinidadian and Tobagonian (71.5%, a difference of 0.20%), and Immigrants from Iran (71.8%, a difference of 0.21%).
| Demographics | Rating | Rank | In Labor Force | Age 20-24 |
| Immigrants | Cuba | 0.0 /100 | #310 | Tragic 72.0% |
| Apache | 0.0 /100 | #311 | Tragic 72.0% |
| Immigrants | Caribbean | 0.0 /100 | #312 | Tragic 71.9% |
| Immigrants | Dominica | 0.0 /100 | #313 | Tragic 71.9% |
| Indians (Asian) | 0.0 /100 | #314 | Tragic 71.9% |
| Immigrants | Iran | 0.0 /100 | #315 | Tragic 71.8% |
| Immigrants | Eastern Asia | 0.0 /100 | #316 | Tragic 71.8% |
| Immigrants | Armenia | 0.0 /100 | #317 | Tragic 71.7% |
| Immigrants | Hong Kong | 0.0 /100 | #318 | Tragic 71.6% |
| Immigrants | Israel | 0.0 /100 | #319 | Tragic 71.6% |
| Trinidadians and Tobagonians | 0.0 /100 | #320 | Tragic 71.5% |
| Immigrants | Taiwan | 0.0 /100 | #321 | Tragic 71.5% |
| Filipinos | 0.0 /100 | #322 | Tragic 71.4% |
| West Indians | 0.0 /100 | #323 | Tragic 71.3% |
| Immigrants | Dominican Republic | 0.0 /100 | #324 | Tragic 71.2% |
Demographics Similar to Ugandans by In Labor Force | Age 20-24
In terms of in labor force | age 20-24, the demographic groups most similar to Ugandans are Immigrants from Cambodia (75.4%, a difference of 0.010%), Salvadoran (75.3%, a difference of 0.020%), Comanche (75.4%, a difference of 0.030%), Paiute (75.3%, a difference of 0.040%), and Lebanese (75.3%, a difference of 0.050%).
| Demographics | Rating | Rank | In Labor Force | Age 20-24 |
| Blackfeet | 83.6 /100 | #142 | Excellent 75.5% |
| Spaniards | 82.0 /100 | #143 | Excellent 75.5% |
| Bhutanese | 80.8 /100 | #144 | Excellent 75.4% |
| Koreans | 79.7 /100 | #145 | Good 75.4% |
| Mexican American Indians | 78.8 /100 | #146 | Good 75.4% |
| Comanche | 77.6 /100 | #147 | Good 75.4% |
| Immigrants | Cambodia | 76.7 /100 | #148 | Good 75.4% |
| Ugandans | 76.1 /100 | #149 | Good 75.4% |
| Salvadorans | 74.8 /100 | #150 | Good 75.3% |
| Paiute | 74.1 /100 | #151 | Good 75.3% |
| Lebanese | 73.5 /100 | #152 | Good 75.3% |
| Guatemalans | 72.3 /100 | #153 | Good 75.3% |
| Osage | 72.3 /100 | #154 | Good 75.3% |
| Immigrants | Guatemala | 71.9 /100 | #155 | Good 75.3% |
| Immigrants | El Salvador | 71.7 /100 | #156 | Good 75.3% |