Icelander vs Immigrants from Trinidad and Tobago In Labor Force | Age 20-24
COMPARE
Icelander
Immigrants from Trinidad and Tobago
In Labor Force | Age 20-24
In Labor Force | Age 20-24 Comparison
Icelanders
Immigrants from Trinidad and Tobago
76.9%
IN LABOR FORCE | AGE 20-24
99.9/ 100
METRIC RATING
66th/ 347
METRIC RANK
71.1%
IN LABOR FORCE | AGE 20-24
0.0/ 100
METRIC RATING
327th/ 347
METRIC RANK
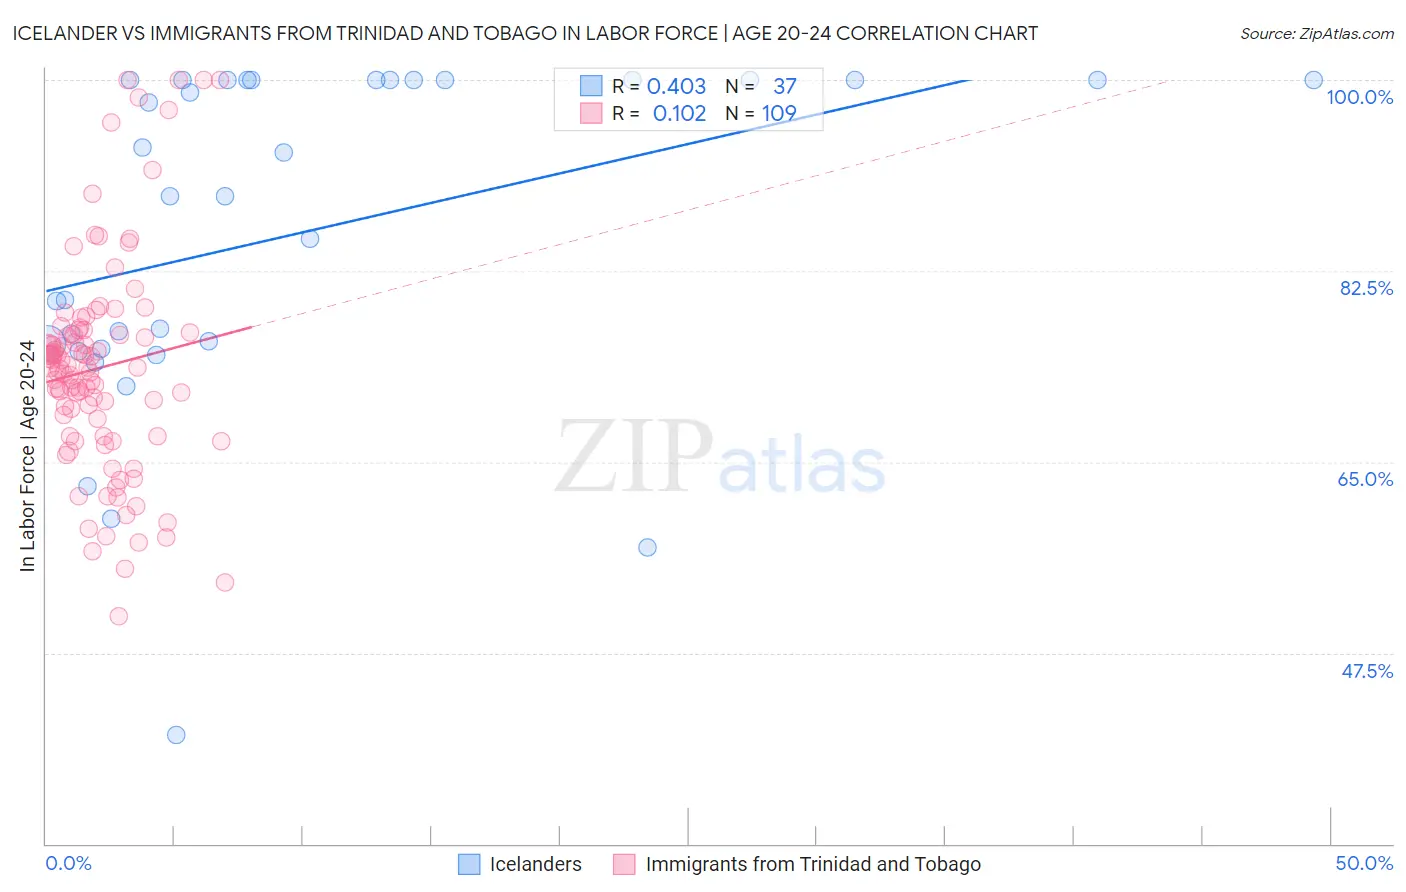
Icelander vs Immigrants from Trinidad and Tobago In Labor Force | Age 20-24 Correlation Chart
The statistical analysis conducted on geographies consisting of 159,597,296 people shows a moderate positive correlation between the proportion of Icelanders and labor force participation rate among population between the ages 20 and 24 in the United States with a correlation coefficient (R) of 0.403 and weighted average of 76.9%. Similarly, the statistical analysis conducted on geographies consisting of 223,471,957 people shows a poor positive correlation between the proportion of Immigrants from Trinidad and Tobago and labor force participation rate among population between the ages 20 and 24 in the United States with a correlation coefficient (R) of 0.102 and weighted average of 71.1%, a difference of 8.2%.
In Labor Force | Age 20-24 Correlation Summary
| Measurement | Icelander | Immigrants from Trinidad and Tobago |
| Minimum | 40.0% | 50.9% |
| Maximum | 100.0% | 100.0% |
| Range | 60.0% | 49.1% |
| Mean | 86.0% | 73.6% |
| Median | 89.3% | 73.6% |
| Interquartile 25% (IQ1) | 75.6% | 67.4% |
| Interquartile 75% (IQ3) | 100.0% | 77.0% |
| Interquartile Range (IQR) | 24.4% | 9.6% |
| Standard Deviation (Sample) | 15.4% | 10.0% |
| Standard Deviation (Population) | 15.2% | 9.9% |
Similar Demographics by In Labor Force | Age 20-24
Demographics Similar to Icelanders by In Labor Force | Age 20-24
In terms of in labor force | age 20-24, the demographic groups most similar to Icelanders are Slavic (76.9%, a difference of 0.010%), Crow (76.9%, a difference of 0.020%), French American Indian (76.8%, a difference of 0.040%), Immigrants from Sudan (76.8%, a difference of 0.060%), and White/Caucasian (76.9%, a difference of 0.070%).
| Demographics | Rating | Rank | In Labor Force | Age 20-24 |
| Scotch-Irish | 99.9 /100 | #59 | Exceptional 77.0% |
| Kenyans | 99.9 /100 | #60 | Exceptional 77.0% |
| Immigrants | Eritrea | 99.9 /100 | #61 | Exceptional 77.0% |
| Immigrants | Kenya | 99.9 /100 | #62 | Exceptional 77.0% |
| Lithuanians | 99.9 /100 | #63 | Exceptional 77.0% |
| Whites/Caucasians | 99.9 /100 | #64 | Exceptional 76.9% |
| Crow | 99.9 /100 | #65 | Exceptional 76.9% |
| Icelanders | 99.9 /100 | #66 | Exceptional 76.9% |
| Slavs | 99.9 /100 | #67 | Exceptional 76.9% |
| French American Indians | 99.8 /100 | #68 | Exceptional 76.8% |
| Immigrants | Sudan | 99.8 /100 | #69 | Exceptional 76.8% |
| Ottawa | 99.8 /100 | #70 | Exceptional 76.8% |
| Northern Europeans | 99.8 /100 | #71 | Exceptional 76.8% |
| Guamanians/Chamorros | 99.8 /100 | #72 | Exceptional 76.7% |
| British | 99.8 /100 | #73 | Exceptional 76.7% |
Demographics Similar to Immigrants from Trinidad and Tobago by In Labor Force | Age 20-24
In terms of in labor force | age 20-24, the demographic groups most similar to Immigrants from Trinidad and Tobago are Dominican (71.1%, a difference of 0.0%), Immigrants from China (71.1%, a difference of 0.020%), Barbadian (71.1%, a difference of 0.090%), Immigrants from Dominican Republic (71.2%, a difference of 0.19%), and Yup'ik (70.9%, a difference of 0.26%).
| Demographics | Rating | Rank | In Labor Force | Age 20-24 |
| Trinidadians and Tobagonians | 0.0 /100 | #320 | Tragic 71.5% |
| Immigrants | Taiwan | 0.0 /100 | #321 | Tragic 71.5% |
| Filipinos | 0.0 /100 | #322 | Tragic 71.4% |
| West Indians | 0.0 /100 | #323 | Tragic 71.3% |
| Immigrants | Dominican Republic | 0.0 /100 | #324 | Tragic 71.2% |
| Barbadians | 0.0 /100 | #325 | Tragic 71.1% |
| Dominicans | 0.0 /100 | #326 | Tragic 71.1% |
| Immigrants | Trinidad and Tobago | 0.0 /100 | #327 | Tragic 71.1% |
| Immigrants | China | 0.0 /100 | #328 | Tragic 71.1% |
| Yup'ik | 0.0 /100 | #329 | Tragic 70.9% |
| Vietnamese | 0.0 /100 | #330 | Tragic 70.6% |
| Immigrants | Bangladesh | 0.0 /100 | #331 | Tragic 70.6% |
| Immigrants | Uzbekistan | 0.0 /100 | #332 | Tragic 70.4% |
| Yuman | 0.0 /100 | #333 | Tragic 70.3% |
| British West Indians | 0.0 /100 | #334 | Tragic 70.0% |