Syrian vs Immigrants from Trinidad and Tobago In Labor Force | Age 20-24
COMPARE
Syrian
Immigrants from Trinidad and Tobago
In Labor Force | Age 20-24
In Labor Force | Age 20-24 Comparison
Syrians
Immigrants from Trinidad and Tobago
75.0%
IN LABOR FORCE | AGE 20-24
49.5/ 100
METRIC RATING
175th/ 347
METRIC RANK
71.1%
IN LABOR FORCE | AGE 20-24
0.0/ 100
METRIC RATING
327th/ 347
METRIC RANK
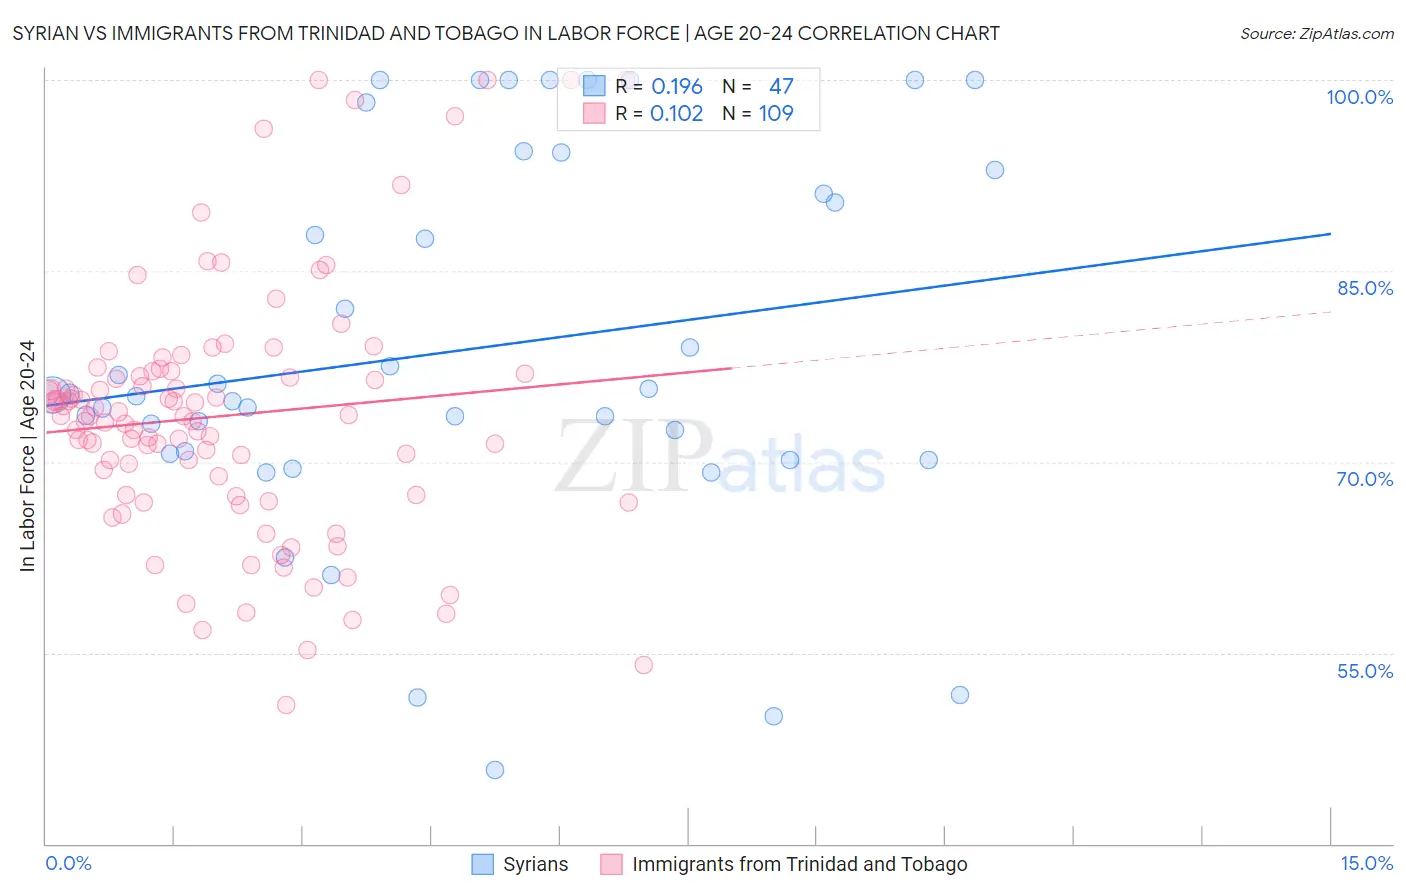
Syrian vs Immigrants from Trinidad and Tobago In Labor Force | Age 20-24 Correlation Chart
The statistical analysis conducted on geographies consisting of 266,259,470 people shows a poor positive correlation between the proportion of Syrians and labor force participation rate among population between the ages 20 and 24 in the United States with a correlation coefficient (R) of 0.196 and weighted average of 75.0%. Similarly, the statistical analysis conducted on geographies consisting of 223,471,957 people shows a poor positive correlation between the proportion of Immigrants from Trinidad and Tobago and labor force participation rate among population between the ages 20 and 24 in the United States with a correlation coefficient (R) of 0.102 and weighted average of 71.1%, a difference of 5.6%.
In Labor Force | Age 20-24 Correlation Summary
| Measurement | Syrian | Immigrants from Trinidad and Tobago |
| Minimum | 45.8% | 50.9% |
| Maximum | 100.0% | 100.0% |
| Range | 54.2% | 49.1% |
| Mean | 78.8% | 73.6% |
| Median | 75.3% | 73.6% |
| Interquartile 25% (IQ1) | 70.6% | 67.4% |
| Interquartile 75% (IQ3) | 92.9% | 77.0% |
| Interquartile Range (IQR) | 22.3% | 9.6% |
| Standard Deviation (Sample) | 14.7% | 10.0% |
| Standard Deviation (Population) | 14.5% | 9.9% |
Similar Demographics by In Labor Force | Age 20-24
Demographics Similar to Syrians by In Labor Force | Age 20-24
In terms of in labor force | age 20-24, the demographic groups most similar to Syrians are Immigrants from Croatia (75.1%, a difference of 0.010%), South African (75.0%, a difference of 0.010%), Central American (75.0%, a difference of 0.010%), Cajun (75.1%, a difference of 0.020%), and Yakama (75.1%, a difference of 0.020%).
| Demographics | Rating | Rank | In Labor Force | Age 20-24 |
| Immigrants | Western Africa | 56.7 /100 | #168 | Average 75.1% |
| Immigrants | Philippines | 55.8 /100 | #169 | Average 75.1% |
| Mexicans | 52.1 /100 | #170 | Average 75.1% |
| Cajuns | 51.1 /100 | #171 | Average 75.1% |
| Yakama | 50.8 /100 | #172 | Average 75.1% |
| Immigrants | Croatia | 50.2 /100 | #173 | Average 75.1% |
| South Africans | 50.0 /100 | #174 | Average 75.0% |
| Syrians | 49.5 /100 | #175 | Average 75.0% |
| Central Americans | 48.7 /100 | #176 | Average 75.0% |
| Immigrants | Mexico | 47.8 /100 | #177 | Average 75.0% |
| Immigrants | Central America | 45.0 /100 | #178 | Average 75.0% |
| Immigrants | Latvia | 44.1 /100 | #179 | Average 75.0% |
| Immigrants | Czechoslovakia | 44.0 /100 | #180 | Average 75.0% |
| Africans | 42.5 /100 | #181 | Average 75.0% |
| Immigrants | South Africa | 36.9 /100 | #182 | Fair 74.9% |
Demographics Similar to Immigrants from Trinidad and Tobago by In Labor Force | Age 20-24
In terms of in labor force | age 20-24, the demographic groups most similar to Immigrants from Trinidad and Tobago are Dominican (71.1%, a difference of 0.0%), Immigrants from China (71.1%, a difference of 0.020%), Barbadian (71.1%, a difference of 0.090%), Immigrants from Dominican Republic (71.2%, a difference of 0.19%), and Yup'ik (70.9%, a difference of 0.26%).
| Demographics | Rating | Rank | In Labor Force | Age 20-24 |
| Trinidadians and Tobagonians | 0.0 /100 | #320 | Tragic 71.5% |
| Immigrants | Taiwan | 0.0 /100 | #321 | Tragic 71.5% |
| Filipinos | 0.0 /100 | #322 | Tragic 71.4% |
| West Indians | 0.0 /100 | #323 | Tragic 71.3% |
| Immigrants | Dominican Republic | 0.0 /100 | #324 | Tragic 71.2% |
| Barbadians | 0.0 /100 | #325 | Tragic 71.1% |
| Dominicans | 0.0 /100 | #326 | Tragic 71.1% |
| Immigrants | Trinidad and Tobago | 0.0 /100 | #327 | Tragic 71.1% |
| Immigrants | China | 0.0 /100 | #328 | Tragic 71.1% |
| Yup'ik | 0.0 /100 | #329 | Tragic 70.9% |
| Vietnamese | 0.0 /100 | #330 | Tragic 70.6% |
| Immigrants | Bangladesh | 0.0 /100 | #331 | Tragic 70.6% |
| Immigrants | Uzbekistan | 0.0 /100 | #332 | Tragic 70.4% |
| Yuman | 0.0 /100 | #333 | Tragic 70.3% |
| British West Indians | 0.0 /100 | #334 | Tragic 70.0% |