Kiowa vs Immigrants from Greece 10th Grade
COMPARE
Kiowa
Immigrants from Greece
10th Grade
10th Grade Comparison
Kiowa
Immigrants from Greece
93.9%
10TH GRADE
73.3/ 100
METRIC RATING
157th/ 347
METRIC RANK
94.3%
10TH GRADE
92.7/ 100
METRIC RATING
130th/ 347
METRIC RANK
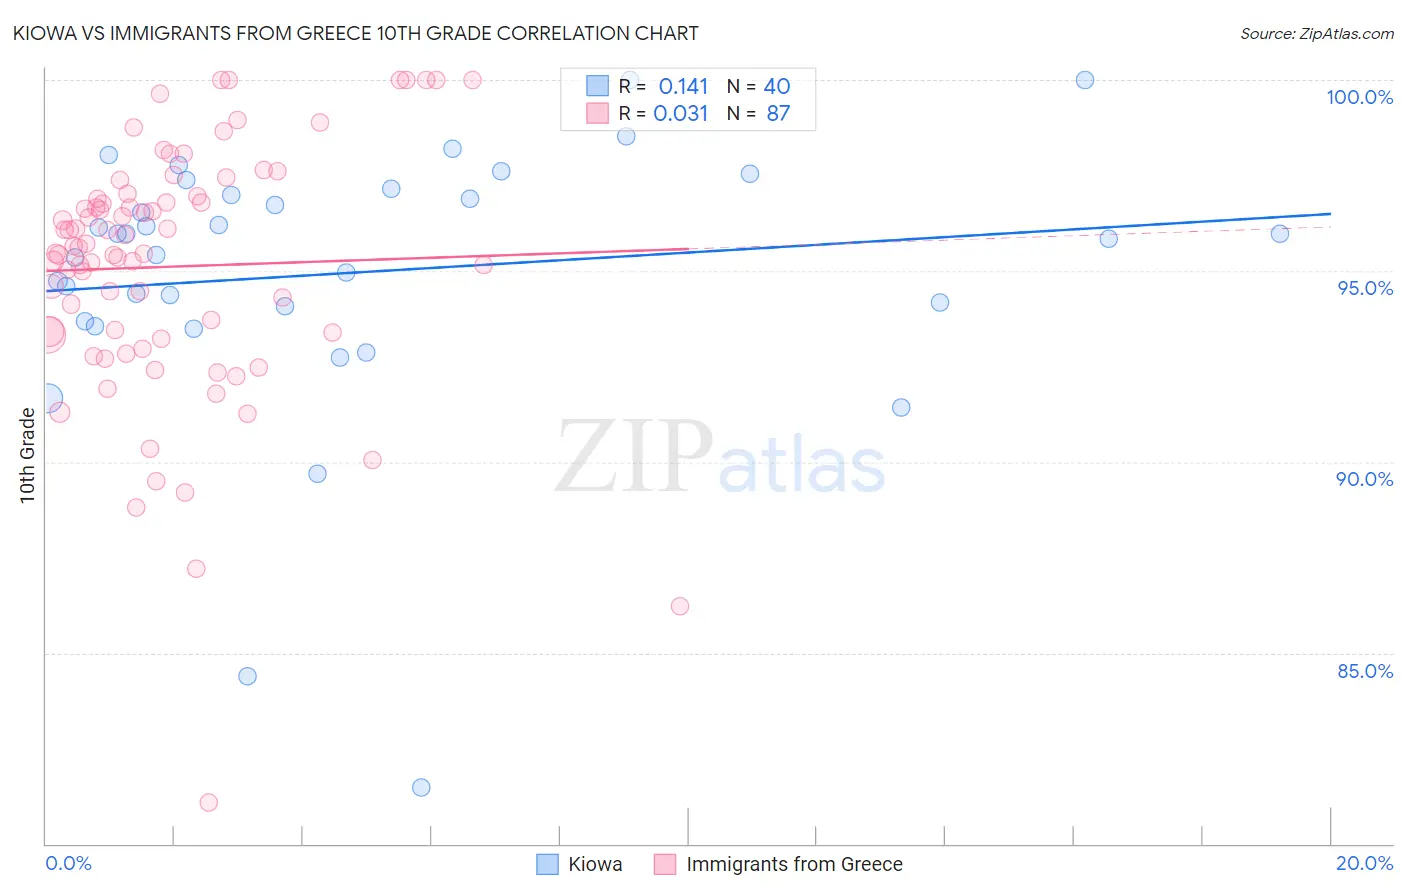
Kiowa vs Immigrants from Greece 10th Grade Correlation Chart
The statistical analysis conducted on geographies consisting of 56,101,759 people shows a poor positive correlation between the proportion of Kiowa and percentage of population with at least 10th grade education in the United States with a correlation coefficient (R) of 0.141 and weighted average of 93.9%. Similarly, the statistical analysis conducted on geographies consisting of 216,879,847 people shows no correlation between the proportion of Immigrants from Greece and percentage of population with at least 10th grade education in the United States with a correlation coefficient (R) of 0.031 and weighted average of 94.3%, a difference of 0.34%.
10th Grade Correlation Summary
| Measurement | Kiowa | Immigrants from Greece |
| Minimum | 81.5% | 81.1% |
| Maximum | 100.0% | 100.0% |
| Range | 18.5% | 18.9% |
| Mean | 95.0% | 95.1% |
| Median | 95.9% | 95.6% |
| Interquartile 25% (IQ1) | 93.9% | 93.3% |
| Interquartile 75% (IQ3) | 97.1% | 97.0% |
| Interquartile Range (IQR) | 3.2% | 3.7% |
| Standard Deviation (Sample) | 3.6% | 3.3% |
| Standard Deviation (Population) | 3.5% | 3.3% |
Similar Demographics by 10th Grade
Demographics Similar to Kiowa by 10th Grade
In terms of 10th grade, the demographic groups most similar to Kiowa are Mongolian (94.0%, a difference of 0.010%), Immigrants from Kenya (94.0%, a difference of 0.020%), Spanish (94.0%, a difference of 0.020%), Immigrants from Brazil (94.0%, a difference of 0.030%), and Bermudan (93.9%, a difference of 0.030%).
| Demographics | Rating | Rank | 10th Grade |
| Egyptians | 79.6 /100 | #150 | Good 94.0% |
| Kenyans | 79.1 /100 | #151 | Good 94.0% |
| Immigrants | Italy | 78.0 /100 | #152 | Good 94.0% |
| Immigrants | Brazil | 75.5 /100 | #153 | Good 94.0% |
| Immigrants | Kenya | 75.3 /100 | #154 | Good 94.0% |
| Spanish | 74.9 /100 | #155 | Good 94.0% |
| Mongolians | 74.4 /100 | #156 | Good 94.0% |
| Kiowa | 73.3 /100 | #157 | Good 93.9% |
| Bermudans | 71.0 /100 | #158 | Good 93.9% |
| Chileans | 70.2 /100 | #159 | Good 93.9% |
| Pakistanis | 70.1 /100 | #160 | Good 93.9% |
| Assyrians/Chaldeans/Syriacs | 69.7 /100 | #161 | Good 93.9% |
| Immigrants | Poland | 69.6 /100 | #162 | Good 93.9% |
| Venezuelans | 69.5 /100 | #163 | Good 93.9% |
| Iraqis | 68.1 /100 | #164 | Good 93.9% |
Demographics Similar to Immigrants from Greece by 10th Grade
In terms of 10th grade, the demographic groups most similar to Immigrants from Greece are Iroquois (94.3%, a difference of 0.0%), Immigrants from Eastern Europe (94.3%, a difference of 0.010%), Immigrants from Russia (94.3%, a difference of 0.010%), Potawatomi (94.3%, a difference of 0.030%), and Creek (94.2%, a difference of 0.030%).
| Demographics | Rating | Rank | 10th Grade |
| Cree | 95.1 /100 | #123 | Exceptional 94.4% |
| Basques | 94.9 /100 | #124 | Exceptional 94.3% |
| Americans | 94.4 /100 | #125 | Exceptional 94.3% |
| Immigrants | Iran | 94.4 /100 | #126 | Exceptional 94.3% |
| Israelis | 93.8 /100 | #127 | Exceptional 94.3% |
| Potawatomi | 93.6 /100 | #128 | Exceptional 94.3% |
| Iroquois | 92.8 /100 | #129 | Exceptional 94.3% |
| Immigrants | Greece | 92.7 /100 | #130 | Exceptional 94.3% |
| Immigrants | Eastern Europe | 92.5 /100 | #131 | Exceptional 94.3% |
| Immigrants | Russia | 92.4 /100 | #132 | Exceptional 94.3% |
| Creek | 91.9 /100 | #133 | Exceptional 94.2% |
| Osage | 91.7 /100 | #134 | Exceptional 94.2% |
| Immigrants | Korea | 91.3 /100 | #135 | Exceptional 94.2% |
| Shoshone | 90.8 /100 | #136 | Exceptional 94.2% |
| Arapaho | 90.5 /100 | #137 | Exceptional 94.2% |