Kiowa vs Immigrants from Ghana Unemployment Among Ages 16 to 19 years
COMPARE
Kiowa
Immigrants from Ghana
Unemployment Among Ages 16 to 19 years
Unemployment Among Ages 16 to 19 years Comparison
Kiowa
Immigrants from Ghana
25.2%
UNEMPLOYMENT AMONG AGES 16 TO 19 YEARS
0.0/ 100
METRIC RATING
336th/ 347
METRIC RANK
19.8%
UNEMPLOYMENT AMONG AGES 16 TO 19 YEARS
0.0/ 100
METRIC RATING
287th/ 347
METRIC RANK
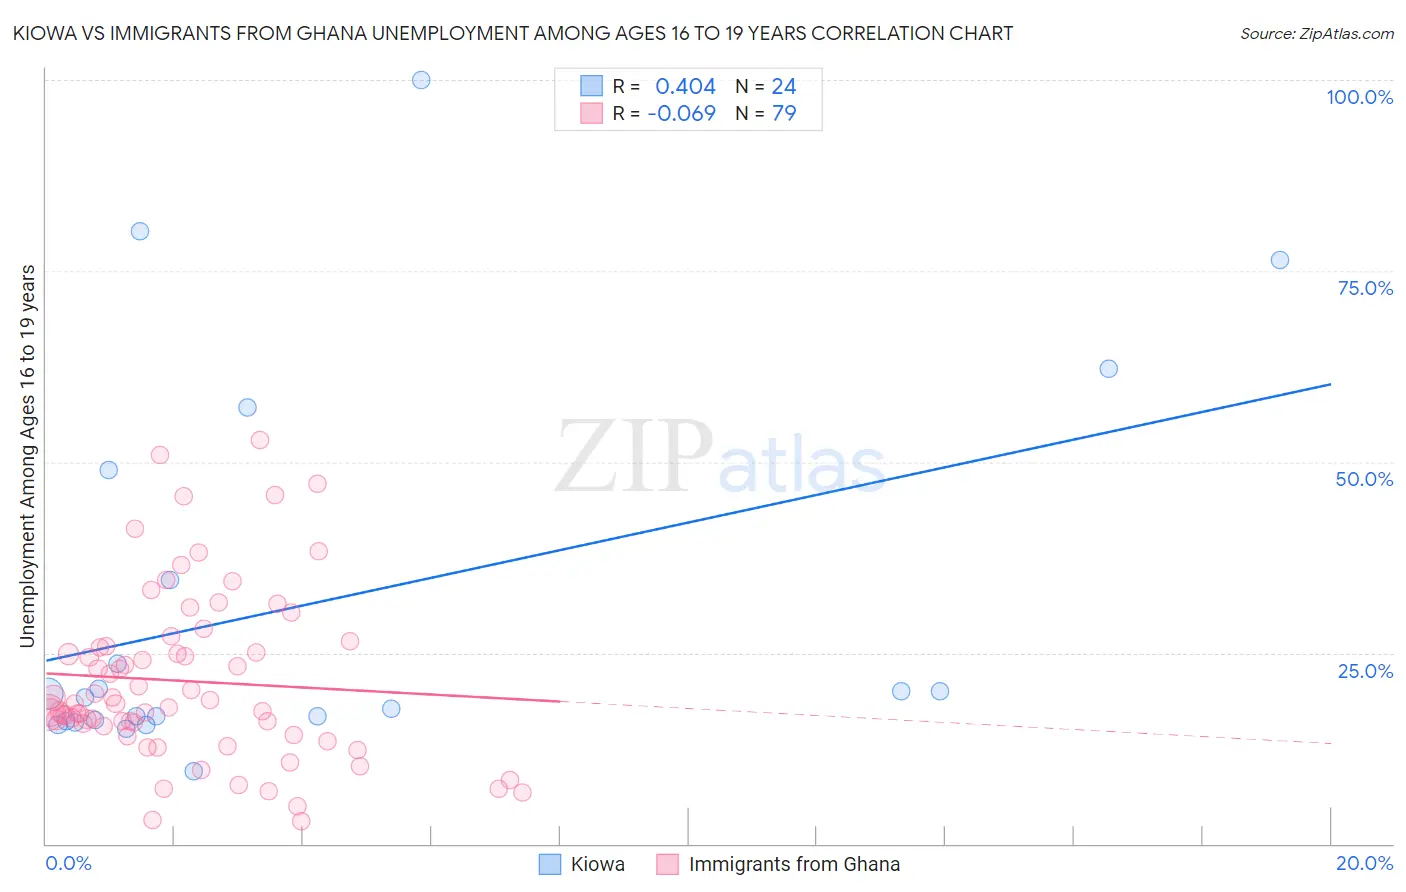
Kiowa vs Immigrants from Ghana Unemployment Among Ages 16 to 19 years Correlation Chart
The statistical analysis conducted on geographies consisting of 55,446,259 people shows a moderate positive correlation between the proportion of Kiowa and unemployment rate among population between the ages 16 and 19 in the United States with a correlation coefficient (R) of 0.404 and weighted average of 25.2%. Similarly, the statistical analysis conducted on geographies consisting of 195,838,231 people shows a slight negative correlation between the proportion of Immigrants from Ghana and unemployment rate among population between the ages 16 and 19 in the United States with a correlation coefficient (R) of -0.069 and weighted average of 19.8%, a difference of 27.3%.
Unemployment Among Ages 16 to 19 years Correlation Summary
| Measurement | Kiowa | Immigrants from Ghana |
| Minimum | 9.5% | 3.0% |
| Maximum | 100.0% | 52.9% |
| Range | 90.5% | 49.9% |
| Mean | 31.4% | 21.3% |
| Median | 19.4% | 18.4% |
| Interquartile 25% (IQ1) | 16.1% | 15.4% |
| Interquartile 75% (IQ3) | 41.7% | 25.9% |
| Interquartile Range (IQR) | 25.6% | 10.5% |
| Standard Deviation (Sample) | 25.2% | 11.0% |
| Standard Deviation (Population) | 24.6% | 10.9% |
Similar Demographics by Unemployment Among Ages 16 to 19 years
Demographics Similar to Kiowa by Unemployment Among Ages 16 to 19 years
In terms of unemployment among ages 16 to 19 years, the demographic groups most similar to Kiowa are Arapaho (25.2%, a difference of 0.21%), Immigrants from Guyana (25.5%, a difference of 1.1%), Guyanese (24.8%, a difference of 1.5%), Immigrants from St. Vincent and the Grenadines (25.7%, a difference of 1.9%), and Immigrants from Grenada (25.7%, a difference of 2.1%).
| Demographics | Rating | Rank | Unemployment Among Ages 16 to 19 years |
| Tlingit-Haida | 0.0 /100 | #329 | Tragic 23.5% |
| Dominicans | 0.0 /100 | #330 | Tragic 23.6% |
| British West Indians | 0.0 /100 | #331 | Tragic 24.0% |
| Immigrants | Barbados | 0.0 /100 | #332 | Tragic 24.0% |
| Paiute | 0.0 /100 | #333 | Tragic 24.4% |
| Guyanese | 0.0 /100 | #334 | Tragic 24.8% |
| Arapaho | 0.0 /100 | #335 | Tragic 25.2% |
| Kiowa | 0.0 /100 | #336 | Tragic 25.2% |
| Immigrants | Guyana | 0.0 /100 | #337 | Tragic 25.5% |
| Immigrants | St. Vincent and the Grenadines | 0.0 /100 | #338 | Tragic 25.7% |
| Immigrants | Grenada | 0.0 /100 | #339 | Tragic 25.7% |
| Crow | 0.0 /100 | #340 | Tragic 26.2% |
| Puerto Ricans | 0.0 /100 | #341 | Tragic 27.5% |
| Inupiat | 0.0 /100 | #342 | Tragic 28.1% |
| Navajo | 0.0 /100 | #343 | Tragic 29.0% |
Demographics Similar to Immigrants from Ghana by Unemployment Among Ages 16 to 19 years
In terms of unemployment among ages 16 to 19 years, the demographic groups most similar to Immigrants from Ghana are Bahamian (19.8%, a difference of 0.060%), Immigrants from the Azores (19.8%, a difference of 0.12%), Ghanaian (19.8%, a difference of 0.19%), Pueblo (19.8%, a difference of 0.29%), and Sierra Leonean (19.7%, a difference of 0.37%).
| Demographics | Rating | Rank | Unemployment Among Ages 16 to 19 years |
| Cajuns | 0.0 /100 | #280 | Tragic 19.6% |
| Cypriots | 0.0 /100 | #281 | Tragic 19.6% |
| Dutch West Indians | 0.0 /100 | #282 | Tragic 19.7% |
| Sioux | 0.0 /100 | #283 | Tragic 19.7% |
| Sierra Leoneans | 0.0 /100 | #284 | Tragic 19.7% |
| Ghanaians | 0.0 /100 | #285 | Tragic 19.8% |
| Bahamians | 0.0 /100 | #286 | Tragic 19.8% |
| Immigrants | Ghana | 0.0 /100 | #287 | Tragic 19.8% |
| Immigrants | Azores | 0.0 /100 | #288 | Tragic 19.8% |
| Pueblo | 0.0 /100 | #289 | Tragic 19.8% |
| Immigrants | Sierra Leone | 0.0 /100 | #290 | Tragic 20.0% |
| Immigrants | Yemen | 0.0 /100 | #291 | Tragic 20.0% |
| Comanche | 0.0 /100 | #292 | Tragic 20.2% |
| Immigrants | Bahamas | 0.0 /100 | #293 | Tragic 20.4% |
| Immigrants | Haiti | 0.0 /100 | #294 | Tragic 20.4% |