Kenyan vs Immigrants from Laos In Labor Force | Age 30-34
COMPARE
Kenyan
Immigrants from Laos
In Labor Force | Age 30-34
In Labor Force | Age 30-34 Comparison
Kenyans
Immigrants from Laos
85.4%
IN LABOR FORCE | AGE 30-34
99.3/ 100
METRIC RATING
67th/ 347
METRIC RANK
84.2%
IN LABOR FORCE | AGE 30-34
3.6/ 100
METRIC RATING
223rd/ 347
METRIC RANK
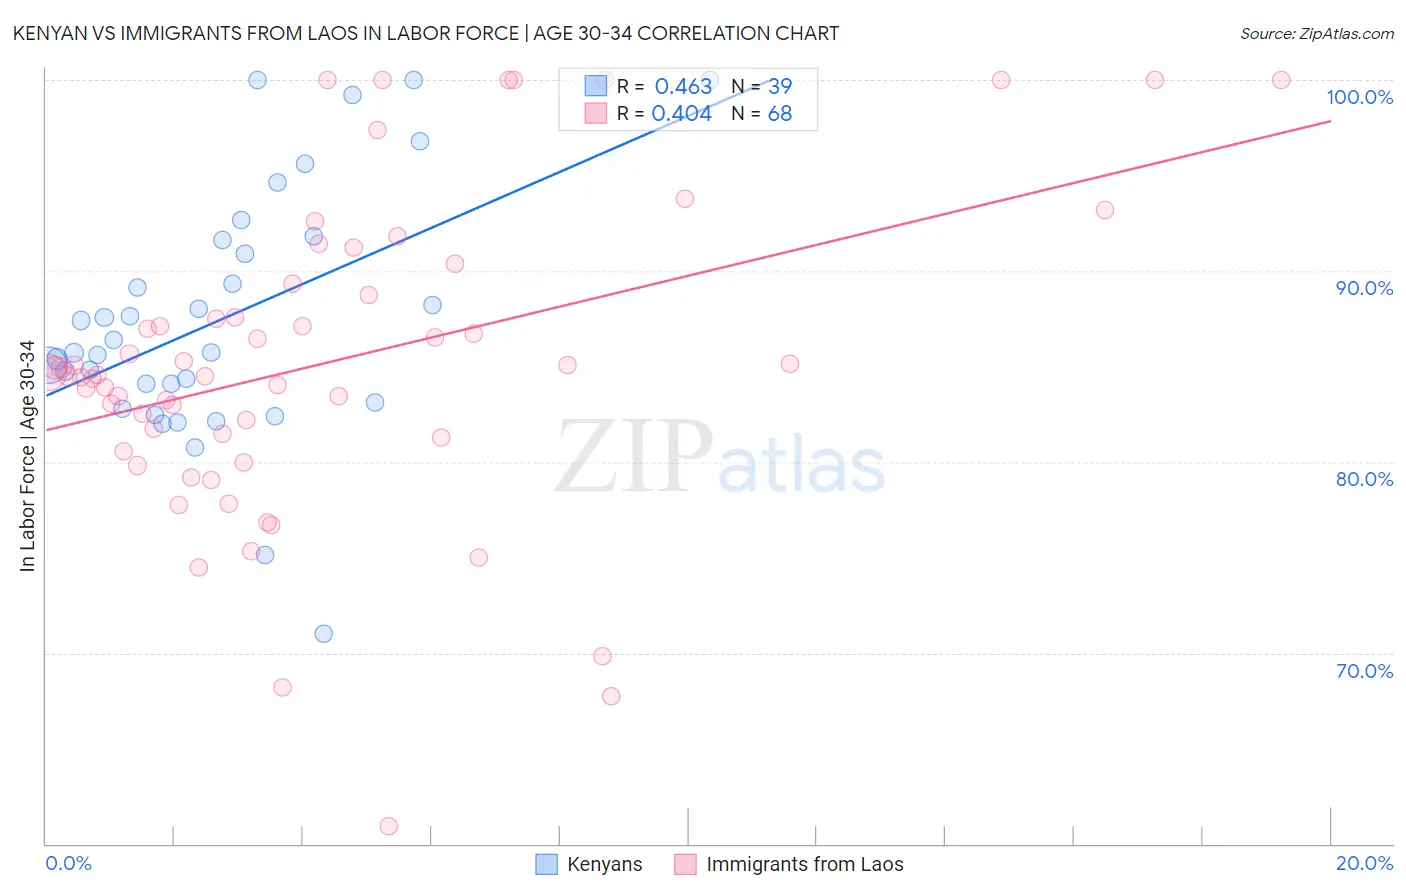
Kenyan vs Immigrants from Laos In Labor Force | Age 30-34 Correlation Chart
The statistical analysis conducted on geographies consisting of 168,200,572 people shows a moderate positive correlation between the proportion of Kenyans and labor force participation rate among population between the ages 30 and 34 in the United States with a correlation coefficient (R) of 0.463 and weighted average of 85.4%. Similarly, the statistical analysis conducted on geographies consisting of 201,465,592 people shows a moderate positive correlation between the proportion of Immigrants from Laos and labor force participation rate among population between the ages 30 and 34 in the United States with a correlation coefficient (R) of 0.404 and weighted average of 84.2%, a difference of 1.5%.
In Labor Force | Age 30-34 Correlation Summary
| Measurement | Kenyan | Immigrants from Laos |
| Minimum | 71.0% | 60.9% |
| Maximum | 100.0% | 100.0% |
| Range | 29.0% | 39.1% |
| Mean | 87.4% | 85.2% |
| Median | 85.7% | 84.6% |
| Interquartile 25% (IQ1) | 83.1% | 81.4% |
| Interquartile 75% (IQ3) | 91.6% | 89.0% |
| Interquartile Range (IQR) | 8.5% | 7.6% |
| Standard Deviation (Sample) | 6.5% | 8.2% |
| Standard Deviation (Population) | 6.4% | 8.2% |
Similar Demographics by In Labor Force | Age 30-34
Demographics Similar to Kenyans by In Labor Force | Age 30-34
In terms of in labor force | age 30-34, the demographic groups most similar to Kenyans are Ghanaian (85.4%, a difference of 0.0%), Senegalese (85.4%, a difference of 0.010%), Immigrants from Eastern Europe (85.4%, a difference of 0.010%), Italian (85.4%, a difference of 0.020%), and Soviet Union (85.5%, a difference of 0.030%).
| Demographics | Rating | Rank | In Labor Force | Age 30-34 |
| Immigrants | France | 99.5 /100 | #60 | Exceptional 85.5% |
| Immigrants | Brazil | 99.5 /100 | #61 | Exceptional 85.5% |
| Soviet Union | 99.4 /100 | #62 | Exceptional 85.5% |
| Macedonians | 99.4 /100 | #63 | Exceptional 85.5% |
| Italians | 99.4 /100 | #64 | Exceptional 85.4% |
| Senegalese | 99.4 /100 | #65 | Exceptional 85.4% |
| Ghanaians | 99.4 /100 | #66 | Exceptional 85.4% |
| Kenyans | 99.3 /100 | #67 | Exceptional 85.4% |
| Immigrants | Eastern Europe | 99.3 /100 | #68 | Exceptional 85.4% |
| Immigrants | Iran | 99.2 /100 | #69 | Exceptional 85.4% |
| Brazilians | 99.1 /100 | #70 | Exceptional 85.4% |
| Immigrants | Japan | 99.1 /100 | #71 | Exceptional 85.4% |
| Immigrants | China | 99.0 /100 | #72 | Exceptional 85.4% |
| Indians (Asian) | 99.0 /100 | #73 | Exceptional 85.4% |
| Maltese | 99.0 /100 | #74 | Exceptional 85.4% |
Demographics Similar to Immigrants from Laos by In Labor Force | Age 30-34
In terms of in labor force | age 30-34, the demographic groups most similar to Immigrants from Laos are Salvadoran (84.2%, a difference of 0.010%), Panamanian (84.2%, a difference of 0.010%), Cuban (84.2%, a difference of 0.010%), Scottish (84.2%, a difference of 0.030%), and Immigrants from El Salvador (84.2%, a difference of 0.030%).
| Demographics | Rating | Rank | In Labor Force | Age 30-34 |
| Immigrants | Ecuador | 7.1 /100 | #216 | Tragic 84.3% |
| Immigrants | Trinidad and Tobago | 7.0 /100 | #217 | Tragic 84.3% |
| Immigrants | Panama | 6.3 /100 | #218 | Tragic 84.3% |
| Swiss | 5.8 /100 | #219 | Tragic 84.3% |
| Danes | 5.3 /100 | #220 | Tragic 84.3% |
| Salvadorans | 3.8 /100 | #221 | Tragic 84.2% |
| Panamanians | 3.8 /100 | #222 | Tragic 84.2% |
| Immigrants | Laos | 3.6 /100 | #223 | Tragic 84.2% |
| Cubans | 3.4 /100 | #224 | Tragic 84.2% |
| Scottish | 3.1 /100 | #225 | Tragic 84.2% |
| Immigrants | El Salvador | 3.0 /100 | #226 | Tragic 84.2% |
| Immigrants | Cuba | 3.0 /100 | #227 | Tragic 84.2% |
| Immigrants | Haiti | 2.8 /100 | #228 | Tragic 84.2% |
| Welsh | 2.7 /100 | #229 | Tragic 84.2% |
| Immigrants | Bahamas | 2.6 /100 | #230 | Tragic 84.1% |