Kenyan vs Immigrants from Sudan In Labor Force | Age 16-19
COMPARE
Kenyan
Immigrants from Sudan
In Labor Force | Age 16-19
In Labor Force | Age 16-19 Comparison
Kenyans
Immigrants from Sudan
40.1%
IN LABOR FORCE | AGE 16-19
100.0/ 100
METRIC RATING
65th/ 347
METRIC RANK
41.0%
IN LABOR FORCE | AGE 16-19
100.0/ 100
METRIC RATING
46th/ 347
METRIC RANK
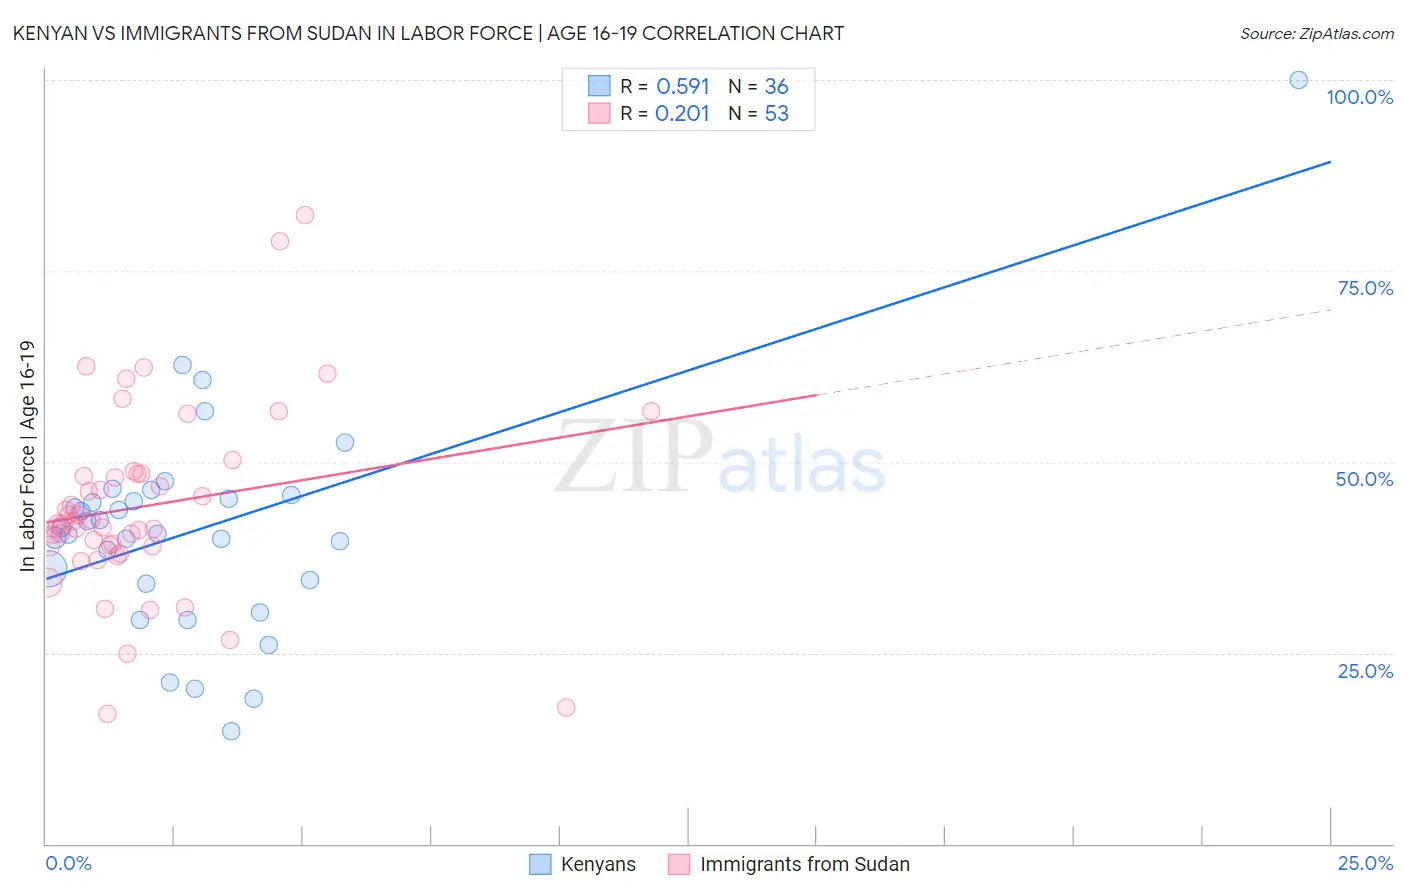
Kenyan vs Immigrants from Sudan In Labor Force | Age 16-19 Correlation Chart
The statistical analysis conducted on geographies consisting of 168,228,993 people shows a substantial positive correlation between the proportion of Kenyans and labor force participation rate among population between the ages 16 and 19 in the United States with a correlation coefficient (R) of 0.591 and weighted average of 40.1%. Similarly, the statistical analysis conducted on geographies consisting of 118,958,697 people shows a weak positive correlation between the proportion of Immigrants from Sudan and labor force participation rate among population between the ages 16 and 19 in the United States with a correlation coefficient (R) of 0.201 and weighted average of 41.0%, a difference of 2.1%.
In Labor Force | Age 16-19 Correlation Summary
| Measurement | Kenyan | Immigrants from Sudan |
| Minimum | 14.8% | 17.1% |
| Maximum | 100.0% | 82.3% |
| Range | 85.2% | 65.2% |
| Mean | 41.2% | 44.2% |
| Median | 41.0% | 41.9% |
| Interquartile 25% (IQ1) | 34.3% | 39.0% |
| Interquartile 75% (IQ3) | 45.4% | 48.5% |
| Interquartile Range (IQR) | 11.1% | 9.5% |
| Standard Deviation (Sample) | 14.8% | 12.3% |
| Standard Deviation (Population) | 14.6% | 12.2% |
Demographics Similar to Kenyans and Immigrants from Sudan by In Labor Force | Age 16-19
In terms of in labor force | age 16-19, the demographic groups most similar to Kenyans are Immigrants from Micronesia (40.2%, a difference of 0.080%), Northern European (40.2%, a difference of 0.19%), Cherokee (40.2%, a difference of 0.25%), American (40.3%, a difference of 0.39%), and Immigrants from Eastern Africa (40.4%, a difference of 0.54%). Similarly, the demographic groups most similar to Immigrants from Sudan are Croatian (41.1%, a difference of 0.32%), Carpatho Rusyn (40.8%, a difference of 0.47%), Icelander (40.8%, a difference of 0.52%), Cree (40.8%, a difference of 0.54%), and Indonesian (40.7%, a difference of 0.70%).
| Demographics | Rating | Rank | In Labor Force | Age 16-19 |
| Croatians | 100.0 /100 | #45 | Exceptional 41.1% |
| Immigrants | Sudan | 100.0 /100 | #46 | Exceptional 41.0% |
| Carpatho Rusyns | 100.0 /100 | #47 | Exceptional 40.8% |
| Icelanders | 100.0 /100 | #48 | Exceptional 40.8% |
| Cree | 100.0 /100 | #49 | Exceptional 40.8% |
| Indonesians | 100.0 /100 | #50 | Exceptional 40.7% |
| Immigrants | Zaire | 100.0 /100 | #51 | Exceptional 40.7% |
| Immigrants | Laos | 100.0 /100 | #52 | Exceptional 40.6% |
| Immigrants | Kenya | 100.0 /100 | #53 | Exceptional 40.5% |
| Tlingit-Haida | 100.0 /100 | #54 | Exceptional 40.5% |
| British | 100.0 /100 | #55 | Exceptional 40.5% |
| Fijians | 100.0 /100 | #56 | Exceptional 40.4% |
| Lithuanians | 100.0 /100 | #57 | Exceptional 40.4% |
| Aleuts | 100.0 /100 | #58 | Exceptional 40.4% |
| Slavs | 100.0 /100 | #59 | Exceptional 40.4% |
| Immigrants | Eastern Africa | 100.0 /100 | #60 | Exceptional 40.4% |
| Americans | 100.0 /100 | #61 | Exceptional 40.3% |
| Cherokee | 100.0 /100 | #62 | Exceptional 40.2% |
| Northern Europeans | 100.0 /100 | #63 | Exceptional 40.2% |
| Immigrants | Micronesia | 100.0 /100 | #64 | Exceptional 40.2% |
| Kenyans | 100.0 /100 | #65 | Exceptional 40.1% |