Jordanian vs Sri Lankan In Labor Force | Age 20-24
COMPARE
Jordanian
Sri Lankan
In Labor Force | Age 20-24
In Labor Force | Age 20-24 Comparison
Jordanians
Sri Lankans
75.5%
IN LABOR FORCE | AGE 20-24
84.8/ 100
METRIC RATING
137th/ 347
METRIC RANK
74.9%
IN LABOR FORCE | AGE 20-24
34.9/ 100
METRIC RATING
185th/ 347
METRIC RANK
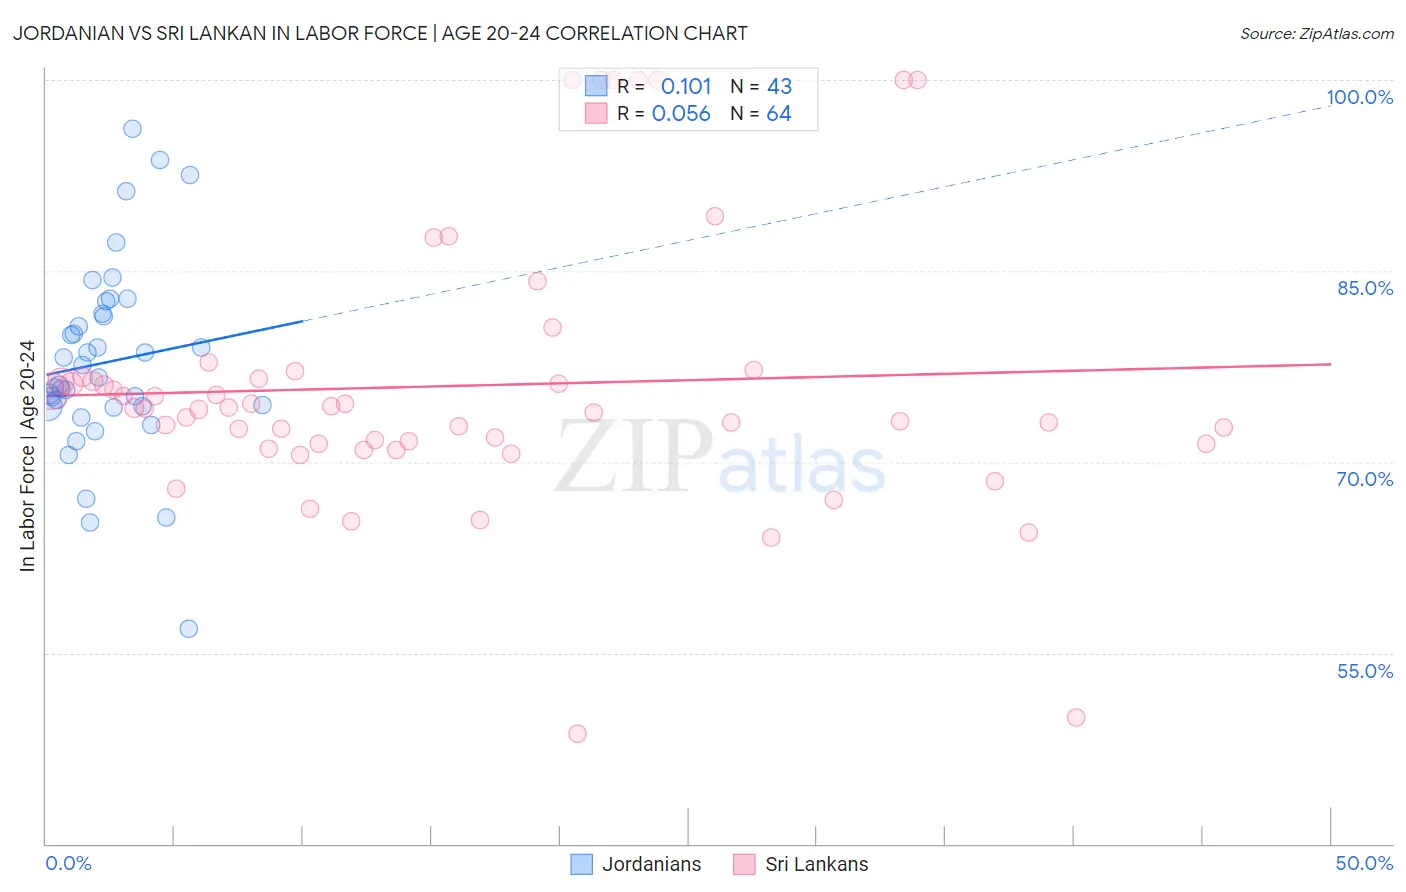
Jordanian vs Sri Lankan In Labor Force | Age 20-24 Correlation Chart
The statistical analysis conducted on geographies consisting of 166,409,280 people shows a poor positive correlation between the proportion of Jordanians and labor force participation rate among population between the ages 20 and 24 in the United States with a correlation coefficient (R) of 0.101 and weighted average of 75.5%. Similarly, the statistical analysis conducted on geographies consisting of 440,468,605 people shows a slight positive correlation between the proportion of Sri Lankans and labor force participation rate among population between the ages 20 and 24 in the United States with a correlation coefficient (R) of 0.056 and weighted average of 74.9%, a difference of 0.86%.
In Labor Force | Age 20-24 Correlation Summary
| Measurement | Jordanian | Sri Lankan |
| Minimum | 56.9% | 48.6% |
| Maximum | 96.2% | 100.0% |
| Range | 39.3% | 51.4% |
| Mean | 77.8% | 76.0% |
| Median | 76.6% | 74.2% |
| Interquartile 25% (IQ1) | 74.3% | 71.4% |
| Interquartile 75% (IQ3) | 81.6% | 76.6% |
| Interquartile Range (IQR) | 7.3% | 5.2% |
| Standard Deviation (Sample) | 7.6% | 10.7% |
| Standard Deviation (Population) | 7.5% | 10.6% |
Similar Demographics by In Labor Force | Age 20-24
Demographics Similar to Jordanians by In Labor Force | Age 20-24
In terms of in labor force | age 20-24, the demographic groups most similar to Jordanians are Immigrants from Brazil (75.5%, a difference of 0.0%), Australian (75.5%, a difference of 0.0%), Immigrants from England (75.5%, a difference of 0.010%), Delaware (75.5%, a difference of 0.010%), and Yaqui (75.5%, a difference of 0.020%).
| Demographics | Rating | Rank | In Labor Force | Age 20-24 |
| Immigrants | Austria | 88.8 /100 | #130 | Excellent 75.6% |
| Immigrants | Jordan | 88.5 /100 | #131 | Excellent 75.6% |
| Palestinians | 88.4 /100 | #132 | Excellent 75.6% |
| Zimbabweans | 88.2 /100 | #133 | Excellent 75.6% |
| Estonians | 87.1 /100 | #134 | Excellent 75.6% |
| Yaqui | 85.5 /100 | #135 | Excellent 75.5% |
| Immigrants | Brazil | 84.8 /100 | #136 | Excellent 75.5% |
| Jordanians | 84.8 /100 | #137 | Excellent 75.5% |
| Australians | 84.8 /100 | #138 | Excellent 75.5% |
| Immigrants | England | 84.6 /100 | #139 | Excellent 75.5% |
| Delaware | 84.5 /100 | #140 | Excellent 75.5% |
| Romanians | 84.1 /100 | #141 | Excellent 75.5% |
| Blackfeet | 83.6 /100 | #142 | Excellent 75.5% |
| Spaniards | 82.0 /100 | #143 | Excellent 75.5% |
| Bhutanese | 80.8 /100 | #144 | Excellent 75.4% |
Demographics Similar to Sri Lankans by In Labor Force | Age 20-24
In terms of in labor force | age 20-24, the demographic groups most similar to Sri Lankans are Immigrants from Hungary (74.9%, a difference of 0.0%), Immigrants from Eastern Europe (74.9%, a difference of 0.020%), Immigrants from Honduras (74.9%, a difference of 0.020%), Immigrants from South Africa (74.9%, a difference of 0.030%), and Immigrants from Costa Rica (74.9%, a difference of 0.030%).
| Demographics | Rating | Rank | In Labor Force | Age 20-24 |
| Immigrants | Central America | 45.0 /100 | #178 | Average 75.0% |
| Immigrants | Latvia | 44.1 /100 | #179 | Average 75.0% |
| Immigrants | Czechoslovakia | 44.0 /100 | #180 | Average 75.0% |
| Africans | 42.5 /100 | #181 | Average 75.0% |
| Immigrants | South Africa | 36.9 /100 | #182 | Fair 74.9% |
| Immigrants | Costa Rica | 36.7 /100 | #183 | Fair 74.9% |
| Immigrants | Hungary | 35.0 /100 | #184 | Fair 74.9% |
| Sri Lankans | 34.9 /100 | #185 | Fair 74.9% |
| Immigrants | Eastern Europe | 33.8 /100 | #186 | Fair 74.9% |
| Immigrants | Honduras | 33.5 /100 | #187 | Fair 74.9% |
| Hondurans | 32.7 /100 | #188 | Fair 74.8% |
| Immigrants | Northern Europe | 32.6 /100 | #189 | Fair 74.8% |
| Russians | 32.2 /100 | #190 | Fair 74.8% |
| Senegalese | 28.1 /100 | #191 | Fair 74.8% |
| Immigrants | Europe | 27.5 /100 | #192 | Fair 74.8% |