Jordanian vs Nepalese In Labor Force | Age 20-64
COMPARE
Jordanian
Nepalese
In Labor Force | Age 20-64
In Labor Force | Age 20-64 Comparison
Jordanians
Nepalese
80.1%
IN LABOR FORCE | AGE 20-64
97.2/ 100
METRIC RATING
85th/ 347
METRIC RANK
77.5%
IN LABOR FORCE | AGE 20-64
0.0/ 100
METRIC RATING
301st/ 347
METRIC RANK
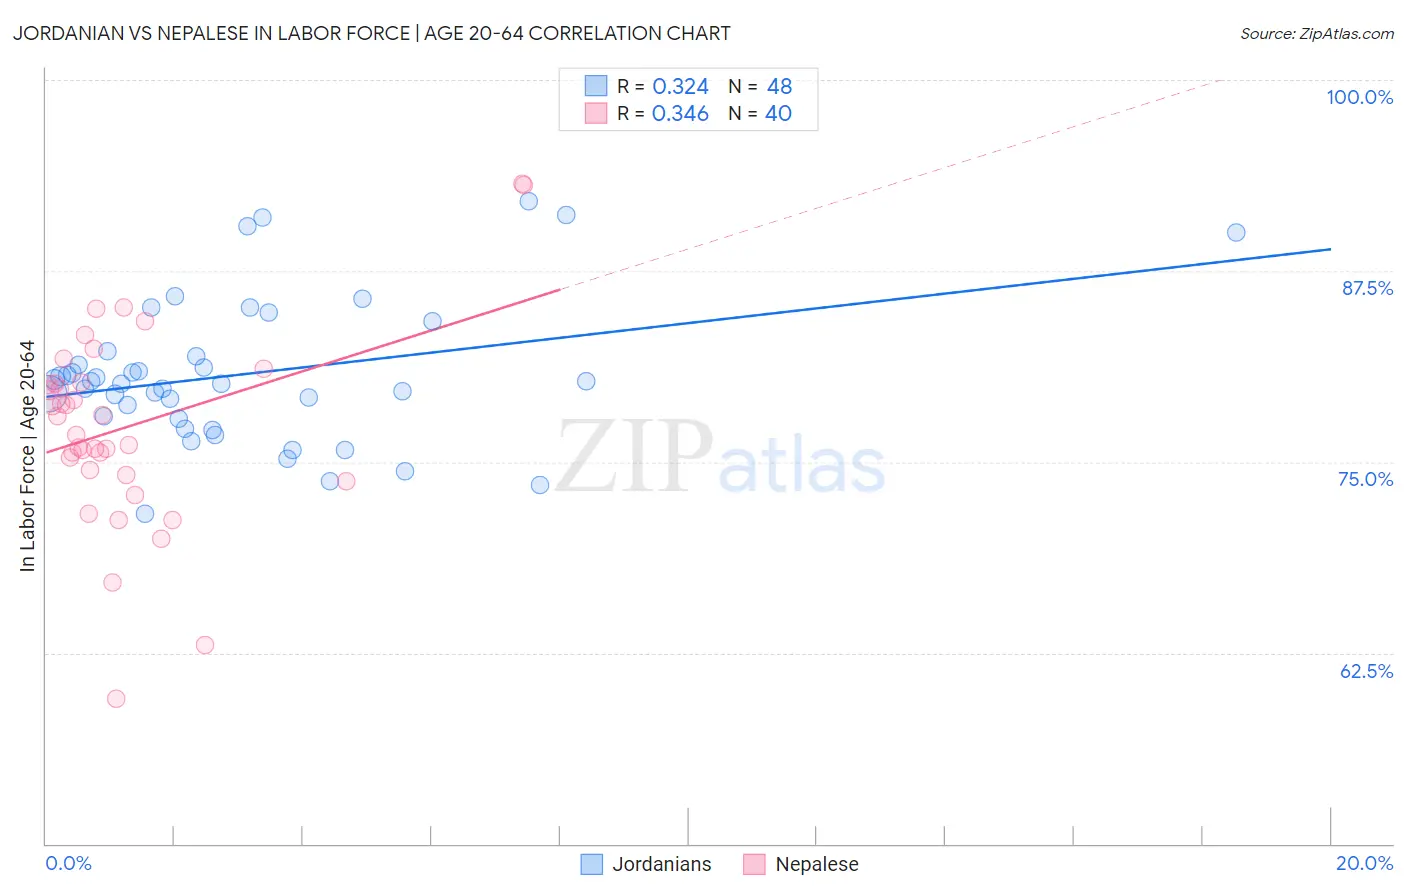
Jordanian vs Nepalese In Labor Force | Age 20-64 Correlation Chart
The statistical analysis conducted on geographies consisting of 166,422,649 people shows a mild positive correlation between the proportion of Jordanians and labor force participation rate among population between the ages 20 and 64 in the United States with a correlation coefficient (R) of 0.324 and weighted average of 80.1%. Similarly, the statistical analysis conducted on geographies consisting of 24,521,755 people shows a mild positive correlation between the proportion of Nepalese and labor force participation rate among population between the ages 20 and 64 in the United States with a correlation coefficient (R) of 0.346 and weighted average of 77.5%, a difference of 3.4%.
In Labor Force | Age 20-64 Correlation Summary
| Measurement | Jordanian | Nepalese |
| Minimum | 71.6% | 59.5% |
| Maximum | 92.1% | 93.2% |
| Range | 20.5% | 33.7% |
| Mean | 80.7% | 77.3% |
| Median | 80.2% | 77.4% |
| Interquartile 25% (IQ1) | 77.9% | 74.3% |
| Interquartile 75% (IQ3) | 82.1% | 80.2% |
| Interquartile Range (IQR) | 4.2% | 5.9% |
| Standard Deviation (Sample) | 4.7% | 6.5% |
| Standard Deviation (Population) | 4.7% | 6.5% |
Similar Demographics by In Labor Force | Age 20-64
Demographics Similar to Jordanians by In Labor Force | Age 20-64
In terms of in labor force | age 20-64, the demographic groups most similar to Jordanians are Immigrants from Egypt (80.1%, a difference of 0.0%), Croatian (80.1%, a difference of 0.0%), German Russian (80.1%, a difference of 0.010%), Immigrants from Japan (80.1%, a difference of 0.010%), and Colombian (80.1%, a difference of 0.010%).
| Demographics | Rating | Rank | In Labor Force | Age 20-64 |
| Immigrants | Romania | 97.8 /100 | #78 | Exceptional 80.2% |
| Asians | 97.7 /100 | #79 | Exceptional 80.2% |
| Immigrants | Croatia | 97.6 /100 | #80 | Exceptional 80.1% |
| German Russians | 97.3 /100 | #81 | Exceptional 80.1% |
| Immigrants | Japan | 97.3 /100 | #82 | Exceptional 80.1% |
| Colombians | 97.3 /100 | #83 | Exceptional 80.1% |
| Immigrants | Latvia | 97.2 /100 | #84 | Exceptional 80.1% |
| Jordanians | 97.2 /100 | #85 | Exceptional 80.1% |
| Immigrants | Egypt | 97.1 /100 | #86 | Exceptional 80.1% |
| Croatians | 97.1 /100 | #87 | Exceptional 80.1% |
| Chileans | 97.0 /100 | #88 | Exceptional 80.1% |
| Immigrants | Venezuela | 96.8 /100 | #89 | Exceptional 80.1% |
| Poles | 96.8 /100 | #90 | Exceptional 80.1% |
| Uruguayans | 96.7 /100 | #91 | Exceptional 80.1% |
| Ghanaians | 96.7 /100 | #92 | Exceptional 80.1% |
Demographics Similar to Nepalese by In Labor Force | Age 20-64
In terms of in labor force | age 20-64, the demographic groups most similar to Nepalese are Spanish American Indian (77.6%, a difference of 0.040%), Iroquois (77.5%, a difference of 0.050%), Hispanic or Latino (77.6%, a difference of 0.11%), Cree (77.7%, a difference of 0.17%), and Immigrants from Dominican Republic (77.7%, a difference of 0.18%).
| Demographics | Rating | Rank | In Labor Force | Age 20-64 |
| Immigrants | Central America | 0.0 /100 | #294 | Tragic 77.7% |
| Immigrants | Grenada | 0.0 /100 | #295 | Tragic 77.7% |
| Immigrants | Dominican Republic | 0.0 /100 | #296 | Tragic 77.7% |
| Dominicans | 0.0 /100 | #297 | Tragic 77.7% |
| Cree | 0.0 /100 | #298 | Tragic 77.7% |
| Hispanics or Latinos | 0.0 /100 | #299 | Tragic 77.6% |
| Spanish American Indians | 0.0 /100 | #300 | Tragic 77.6% |
| Nepalese | 0.0 /100 | #301 | Tragic 77.5% |
| Iroquois | 0.0 /100 | #302 | Tragic 77.5% |
| Chippewa | 0.0 /100 | #303 | Tragic 77.3% |
| Immigrants | Mexico | 0.0 /100 | #304 | Tragic 77.3% |
| Mexicans | 0.0 /100 | #305 | Tragic 77.2% |
| Potawatomi | 0.0 /100 | #306 | Tragic 77.2% |
| Central American Indians | 0.0 /100 | #307 | Tragic 77.1% |
| Alaska Natives | 0.0 /100 | #308 | Tragic 77.0% |