Jordanian vs Immigrants from Micronesia In Labor Force | Age 20-64
COMPARE
Jordanian
Immigrants from Micronesia
In Labor Force | Age 20-64
In Labor Force | Age 20-64 Comparison
Jordanians
Immigrants from Micronesia
80.1%
IN LABOR FORCE | AGE 20-64
97.2/ 100
METRIC RATING
85th/ 347
METRIC RANK
78.9%
IN LABOR FORCE | AGE 20-64
1.9/ 100
METRIC RATING
242nd/ 347
METRIC RANK
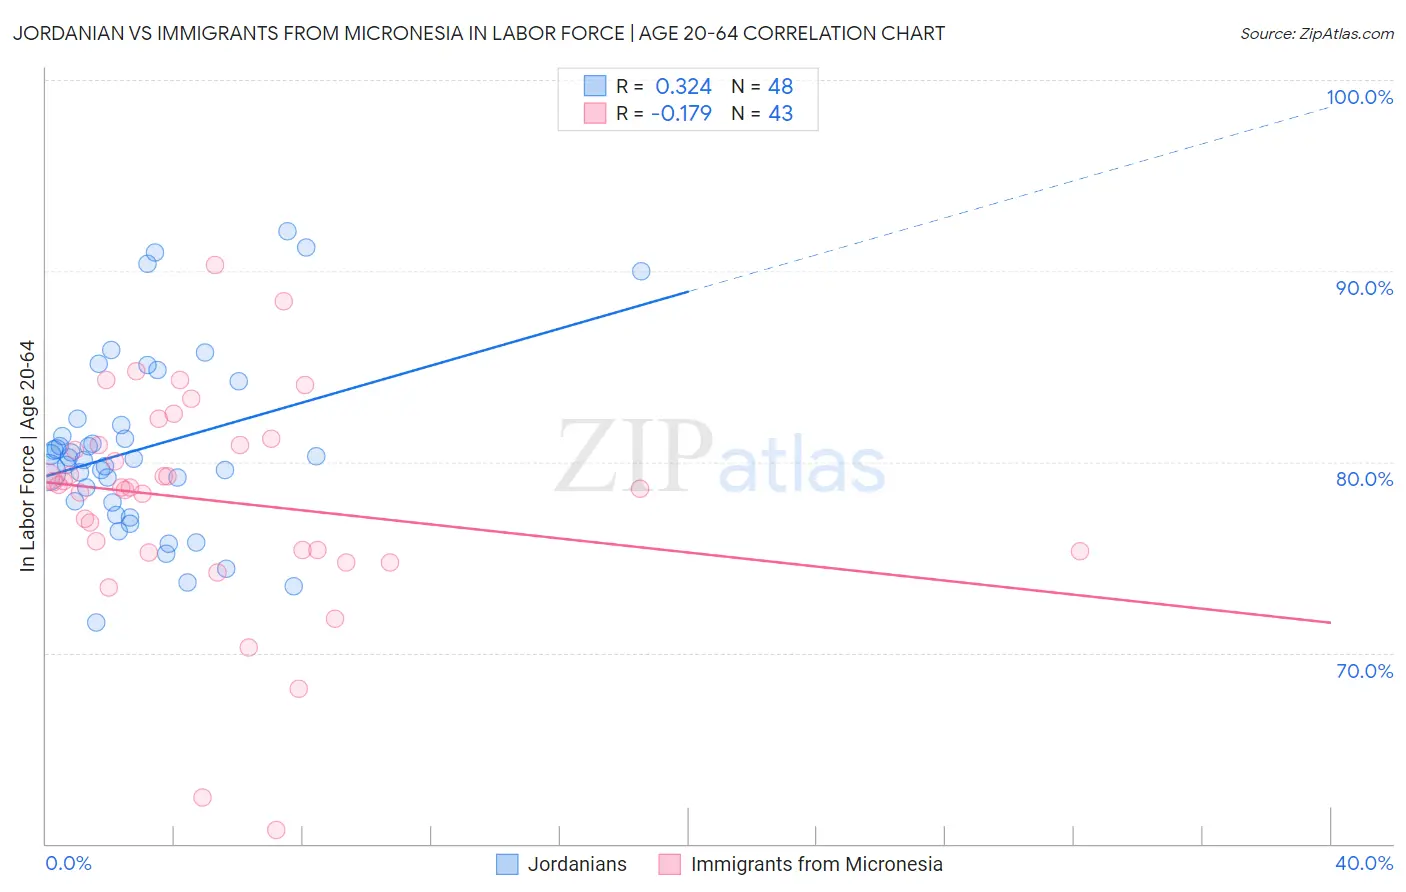
Jordanian vs Immigrants from Micronesia In Labor Force | Age 20-64 Correlation Chart
The statistical analysis conducted on geographies consisting of 166,422,649 people shows a mild positive correlation between the proportion of Jordanians and labor force participation rate among population between the ages 20 and 64 in the United States with a correlation coefficient (R) of 0.324 and weighted average of 80.1%. Similarly, the statistical analysis conducted on geographies consisting of 61,600,666 people shows a poor negative correlation between the proportion of Immigrants from Micronesia and labor force participation rate among population between the ages 20 and 64 in the United States with a correlation coefficient (R) of -0.179 and weighted average of 78.9%, a difference of 1.5%.
In Labor Force | Age 20-64 Correlation Summary
| Measurement | Jordanian | Immigrants from Micronesia |
| Minimum | 71.6% | 60.7% |
| Maximum | 92.1% | 90.3% |
| Range | 20.5% | 29.6% |
| Mean | 80.7% | 78.0% |
| Median | 80.2% | 78.7% |
| Interquartile 25% (IQ1) | 77.9% | 75.3% |
| Interquartile 75% (IQ3) | 82.1% | 80.9% |
| Interquartile Range (IQR) | 4.2% | 5.6% |
| Standard Deviation (Sample) | 4.7% | 5.7% |
| Standard Deviation (Population) | 4.7% | 5.6% |
Similar Demographics by In Labor Force | Age 20-64
Demographics Similar to Jordanians by In Labor Force | Age 20-64
In terms of in labor force | age 20-64, the demographic groups most similar to Jordanians are Immigrants from Egypt (80.1%, a difference of 0.0%), Croatian (80.1%, a difference of 0.0%), German Russian (80.1%, a difference of 0.010%), Immigrants from Japan (80.1%, a difference of 0.010%), and Colombian (80.1%, a difference of 0.010%).
| Demographics | Rating | Rank | In Labor Force | Age 20-64 |
| Immigrants | Romania | 97.8 /100 | #78 | Exceptional 80.2% |
| Asians | 97.7 /100 | #79 | Exceptional 80.2% |
| Immigrants | Croatia | 97.6 /100 | #80 | Exceptional 80.1% |
| German Russians | 97.3 /100 | #81 | Exceptional 80.1% |
| Immigrants | Japan | 97.3 /100 | #82 | Exceptional 80.1% |
| Colombians | 97.3 /100 | #83 | Exceptional 80.1% |
| Immigrants | Latvia | 97.2 /100 | #84 | Exceptional 80.1% |
| Jordanians | 97.2 /100 | #85 | Exceptional 80.1% |
| Immigrants | Egypt | 97.1 /100 | #86 | Exceptional 80.1% |
| Croatians | 97.1 /100 | #87 | Exceptional 80.1% |
| Chileans | 97.0 /100 | #88 | Exceptional 80.1% |
| Immigrants | Venezuela | 96.8 /100 | #89 | Exceptional 80.1% |
| Poles | 96.8 /100 | #90 | Exceptional 80.1% |
| Uruguayans | 96.7 /100 | #91 | Exceptional 80.1% |
| Ghanaians | 96.7 /100 | #92 | Exceptional 80.1% |
Demographics Similar to Immigrants from Micronesia by In Labor Force | Age 20-64
In terms of in labor force | age 20-64, the demographic groups most similar to Immigrants from Micronesia are Jamaican (78.9%, a difference of 0.010%), Immigrants from West Indies (78.9%, a difference of 0.020%), Welsh (79.0%, a difference of 0.040%), Trinidadian and Tobagonian (79.0%, a difference of 0.040%), and French (78.9%, a difference of 0.050%).
| Demographics | Rating | Rank | In Labor Force | Age 20-64 |
| Tlingit-Haida | 3.2 /100 | #235 | Tragic 79.0% |
| Samoans | 2.9 /100 | #236 | Tragic 79.0% |
| Immigrants | North America | 2.9 /100 | #237 | Tragic 79.0% |
| Immigrants | Jamaica | 2.6 /100 | #238 | Tragic 79.0% |
| Welsh | 2.4 /100 | #239 | Tragic 79.0% |
| Trinidadians and Tobagonians | 2.3 /100 | #240 | Tragic 79.0% |
| Jamaicans | 2.0 /100 | #241 | Tragic 78.9% |
| Immigrants | Micronesia | 1.9 /100 | #242 | Tragic 78.9% |
| Immigrants | West Indies | 1.7 /100 | #243 | Tragic 78.9% |
| French | 1.5 /100 | #244 | Tragic 78.9% |
| Scottish | 1.3 /100 | #245 | Tragic 78.9% |
| Immigrants | Trinidad and Tobago | 1.1 /100 | #246 | Tragic 78.8% |
| Immigrants | Germany | 1.0 /100 | #247 | Tragic 78.8% |
| Immigrants | Caribbean | 1.0 /100 | #248 | Tragic 78.8% |
| English | 0.9 /100 | #249 | Tragic 78.8% |