Jamaican vs Immigrants from Scotland In Labor Force | Age 30-34
COMPARE
Jamaican
Immigrants from Scotland
In Labor Force | Age 30-34
In Labor Force | Age 30-34 Comparison
Jamaicans
Immigrants from Scotland
84.3%
IN LABOR FORCE | AGE 30-34
8.8/ 100
METRIC RATING
209th/ 347
METRIC RANK
85.1%
IN LABOR FORCE | AGE 30-34
94.9/ 100
METRIC RATING
111th/ 347
METRIC RANK
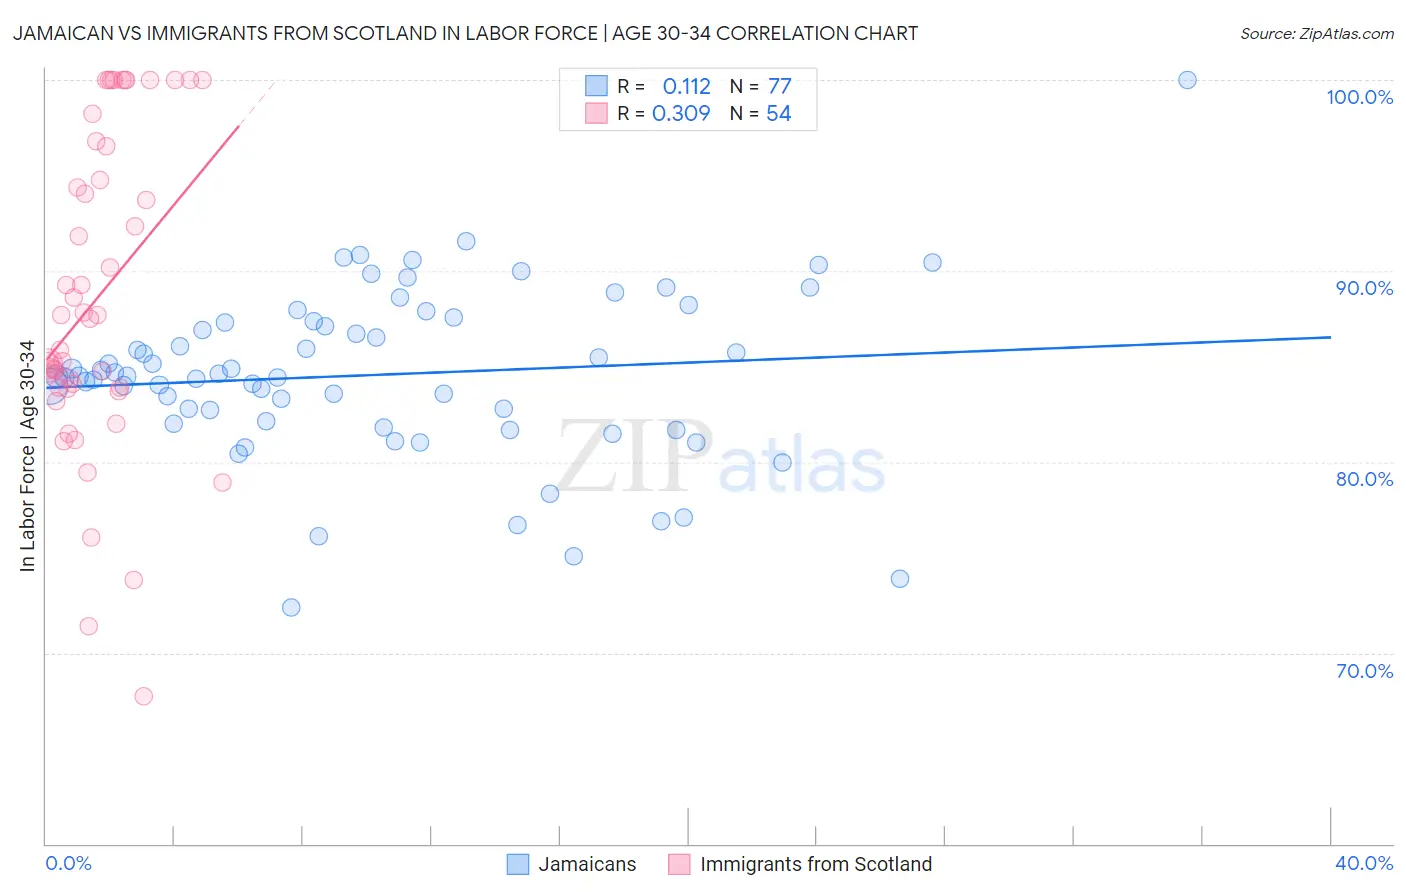
Jamaican vs Immigrants from Scotland In Labor Force | Age 30-34 Correlation Chart
The statistical analysis conducted on geographies consisting of 367,736,864 people shows a poor positive correlation between the proportion of Jamaicans and labor force participation rate among population between the ages 30 and 34 in the United States with a correlation coefficient (R) of 0.112 and weighted average of 84.3%. Similarly, the statistical analysis conducted on geographies consisting of 196,354,267 people shows a mild positive correlation between the proportion of Immigrants from Scotland and labor force participation rate among population between the ages 30 and 34 in the United States with a correlation coefficient (R) of 0.309 and weighted average of 85.1%, a difference of 0.93%.
In Labor Force | Age 30-34 Correlation Summary
| Measurement | Jamaican | Immigrants from Scotland |
| Minimum | 72.4% | 67.7% |
| Maximum | 100.0% | 100.0% |
| Range | 27.6% | 32.3% |
| Mean | 84.6% | 88.6% |
| Median | 84.5% | 87.6% |
| Interquartile 25% (IQ1) | 82.1% | 83.9% |
| Interquartile 75% (IQ3) | 87.3% | 96.5% |
| Interquartile Range (IQR) | 5.3% | 12.7% |
| Standard Deviation (Sample) | 4.5% | 8.2% |
| Standard Deviation (Population) | 4.4% | 8.1% |
Similar Demographics by In Labor Force | Age 30-34
Demographics Similar to Jamaicans by In Labor Force | Age 30-34
In terms of in labor force | age 30-34, the demographic groups most similar to Jamaicans are Arab (84.3%, a difference of 0.0%), Indonesian (84.3%, a difference of 0.0%), Japanese (84.3%, a difference of 0.0%), Bangladeshi (84.3%, a difference of 0.010%), and Immigrants from Western Asia (84.3%, a difference of 0.010%).
| Demographics | Rating | Rank | In Labor Force | Age 30-34 |
| Immigrants | West Indies | 18.1 /100 | #202 | Poor 84.5% |
| Canadians | 15.4 /100 | #203 | Poor 84.4% |
| Ecuadorians | 14.2 /100 | #204 | Poor 84.4% |
| French | 13.8 /100 | #205 | Poor 84.4% |
| Lebanese | 10.6 /100 | #206 | Poor 84.4% |
| Bangladeshis | 9.4 /100 | #207 | Tragic 84.3% |
| Arabs | 8.9 /100 | #208 | Tragic 84.3% |
| Jamaicans | 8.8 /100 | #209 | Tragic 84.3% |
| Indonesians | 8.8 /100 | #210 | Tragic 84.3% |
| Japanese | 8.8 /100 | #211 | Tragic 84.3% |
| Immigrants | Western Asia | 8.2 /100 | #212 | Tragic 84.3% |
| Immigrants | Jamaica | 7.9 /100 | #213 | Tragic 84.3% |
| Immigrants | Germany | 7.2 /100 | #214 | Tragic 84.3% |
| Europeans | 7.2 /100 | #215 | Tragic 84.3% |
| Immigrants | Ecuador | 7.1 /100 | #216 | Tragic 84.3% |
Demographics Similar to Immigrants from Scotland by In Labor Force | Age 30-34
In terms of in labor force | age 30-34, the demographic groups most similar to Immigrants from Scotland are Immigrants from Hungary (85.1%, a difference of 0.0%), Immigrants from Romania (85.1%, a difference of 0.010%), Yugoslavian (85.1%, a difference of 0.010%), Immigrants from South Central Asia (85.1%, a difference of 0.010%), and Egyptian (85.1%, a difference of 0.010%).
| Demographics | Rating | Rank | In Labor Force | Age 30-34 |
| Immigrants | Ghana | 96.5 /100 | #104 | Exceptional 85.2% |
| Alsatians | 96.3 /100 | #105 | Exceptional 85.2% |
| Immigrants | Middle Africa | 96.3 /100 | #106 | Exceptional 85.2% |
| Immigrants | Northern Africa | 96.3 /100 | #107 | Exceptional 85.2% |
| Immigrants | Zimbabwe | 95.8 /100 | #108 | Exceptional 85.1% |
| Argentineans | 95.8 /100 | #109 | Exceptional 85.1% |
| Immigrants | South Africa | 95.3 /100 | #110 | Exceptional 85.1% |
| Immigrants | Scotland | 94.9 /100 | #111 | Exceptional 85.1% |
| Immigrants | Hungary | 94.8 /100 | #112 | Exceptional 85.1% |
| Immigrants | Romania | 94.7 /100 | #113 | Exceptional 85.1% |
| Yugoslavians | 94.7 /100 | #114 | Exceptional 85.1% |
| Immigrants | South Central Asia | 94.6 /100 | #115 | Exceptional 85.1% |
| Egyptians | 94.5 /100 | #116 | Exceptional 85.1% |
| Immigrants | Denmark | 94.3 /100 | #117 | Exceptional 85.1% |
| Immigrants | Malaysia | 94.2 /100 | #118 | Exceptional 85.1% |